. 2011 Aug;8(4):045005.
doi: 10.1088/1741-2560/8/4/045005. Epub 2011 Jul 20.

Long-term stability of neural prosthetic control signals from silicon cortical arrays in rhesus macaque motor cortex

Affiliations

Long-term stability of neural prosthetic control signals from silicon cortical arrays in rhesus macaque motor cortex

Cynthia A Chestek et al. J Neural Eng. 2011 Aug.

Abstract

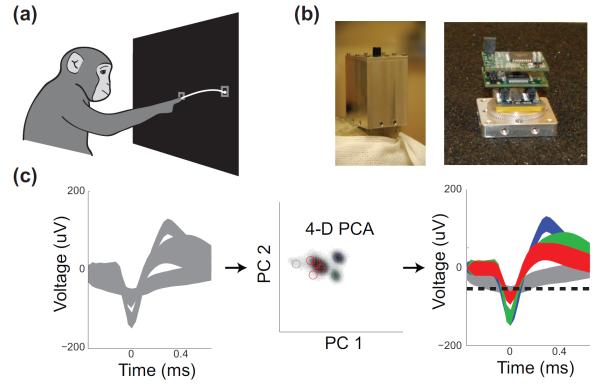
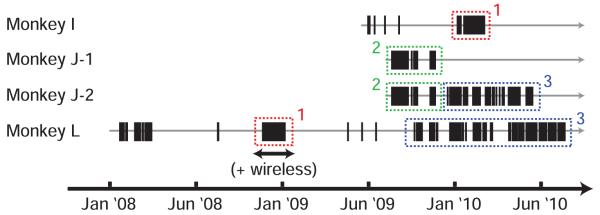
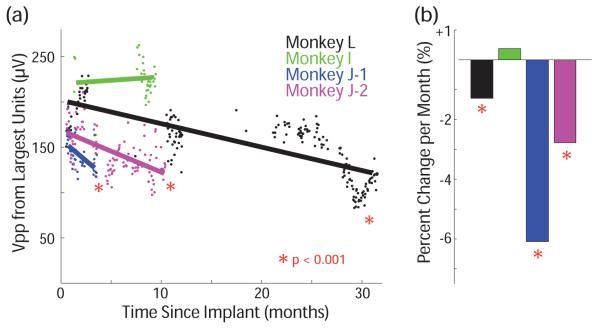
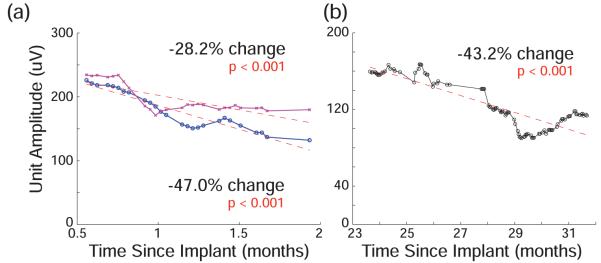
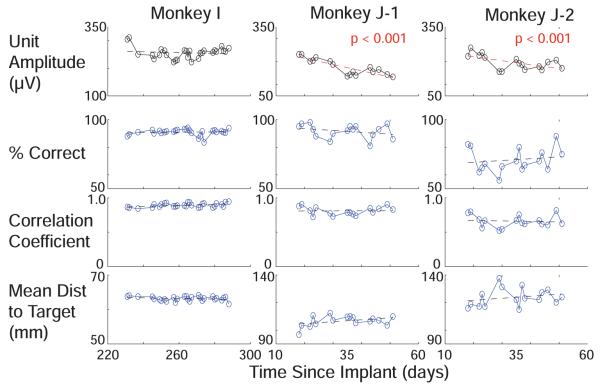
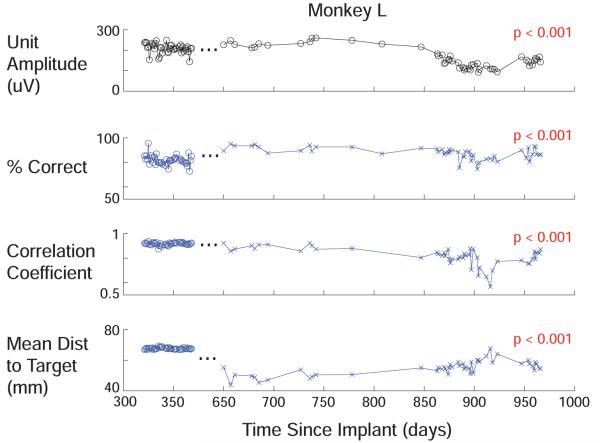
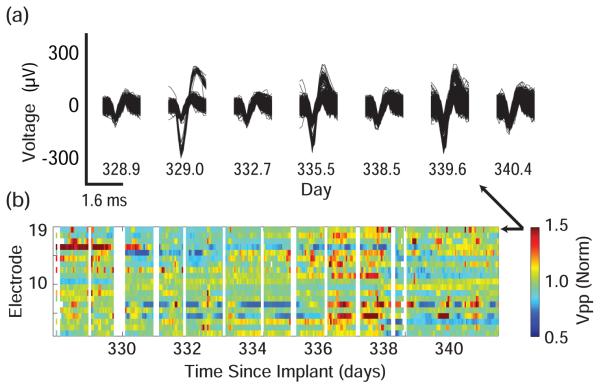
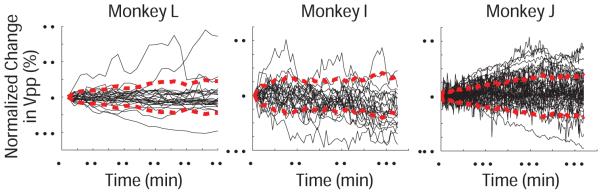
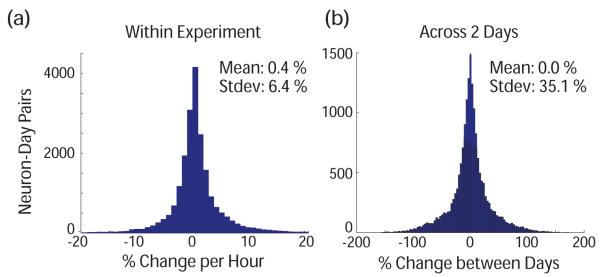
Cortically-controlled prosthetic systems aim to help disabled patients by translating neural signals from the brain into control signals for guiding prosthetic devices. Recent reports have demonstrated reasonably high levels of performance and control of computer cursors and prosthetic limbs, but to achieve true clinical viability, the long-term operation of these systems must be better understood. In particular, the quality and stability of the electrically-recorded neural signals require further characterization. Here, we quantify action potential changes and offline neural decoder performance over 382 days of recording from four intracortical arrays in three animals. Action potential amplitude decreased by 2.4% per month on average over the course of 9.4, 10.4, and 31.7 months in three animals. During most time periods, decoder performance was not well correlated with action potential amplitude (p > 0.05 for three of four arrays). In two arrays from one animal, action potential amplitude declined by an average of 37% over the first 2 months after implant. However, when using simple threshold-crossing events rather than well-isolated action potentials, no corresponding performance loss was observed during this time using an offline decoder. One of these arrays was effectively used for online prosthetic experiments over the following year. Substantial short-term variations in waveforms were quantified using a wireless system for contiguous recording in one animal, and compared within and between days for all three animals. Overall, this study suggests that action potential amplitude declines more slowly than previously supposed, and performance can be maintained over the course of multiple years when decoding from threshold-crossing events rather than isolated action potentials. This suggests that neural prosthetic systems may provide high performance over multiple years in human clinical trials.


Figures

Figure 1
Figure 1
(a) Illustration of experimental setup. Animals made 2D reaches to radial targets. (b) Wireless recording device used for Monkey L [37] (c) Neural data was processed through various filters, and through a principal component based automatic spike sorter [30]. Data were first filtered, peaka-ligned and noise whitened in the leftmost panel. Then, waveforms were projected into 4D principle component space, where units were clustered using an expectation-maximization based mixture of gaussian models, producing the classification shown on the right.
Figure 2
Figure 2
Chart showing when datasets were collected. Tick marks represent 1 day of recording. Gray line represents time each animal was implanted. Dashed boxes indicate times where a consistent center out reach task was performed over more than 30 days such that offline BMI performance could be analyzed. Color and number denotes different but self-consistent tasks. Period with wireless data denoted by black arrow.
Figure 3
Figure 3
(a) Voltage from largest unit on each channel averaged across channels for 4 arrays in 3 animals, where color denotes a specific array. (b) Average change per month in each array.
Figure 4
Figure 4
(a) Voltage from largest unit averaged across the 28 and 38 channels on two arrays from Monkey J that had observed single unit activity in initial dataset during first 2 months of recording (b) Similar data from Monkey L after 2 years of recording. All data is smoothed across a 10 day averaging window to reveal trends.
Figure 5
Figure 5
Top row shows average voltage amplitude across electrodes with observed single unit activity on day one on 3 arrays in 2 animals during periods where the same task was performed for more than 20 days. The number of single unit channels was 34, 28, and 38 electrodes for I, J-A, and J-B. Lower rows show offline decoder performance. For discrete target decoders, performance is measured by percent correct. For a continuous linear decode, performance is measured with correlation coefficient to actual hand position and mean distance to target over the course of the trial. Red lines denote significant trends. No smoothing filters were used.
Figure 6
Figure 6
Top row shows voltage amplitude from largest unit on each electrode averaged across electrodes for Monkey L. Ellipses denotes discontinuity on x axis near month 12. The performance data to the left and right of these ellipses come from different tasks, denoted by symbols, with different average performance, but are self-consistent on either side. Data is more sparse at the beginning of the second period because various training paradigms were attempted, and only a subset of the days included an identical 8 cm center out task with more than 200 trials, though this became standard later on. The same performance metrics as Figure 5 are shown below. On the first task, no significant trends are present. On the second task, voltage declines and recovers significantly (p<0.001), and is significantly correlated with changes in performance using all 3 metrics (p<0.001). No smoothing filters were used.
Figure 7
Figure 7
(a) Example waveforms across days from wireless dataset. Unit is regularly visible and occasionally disappears. (b) Average voltage in 1 hour bins calculated on 19 of 20 active channels across 13 days of wireless recording starting 328 days after implantation. Voltage is normalized to mean voltage on that channel. White space denotes time without wireless recording, usually during daily experimental session. Arrows denote the channel which was plotted in (a).
Figure 8
Figure 8
Changes in single unit amplitude during normal experiments while seated with a fixed head position. Voltage normalized to the size of the single unit at the beginning of the experiment to show percentage change in three animals. Red lines denote the standard deviation from zero.
Figure 9
Figure 9
Distribution of percent changes in waveform voltage amplitude from largest unit on an electrode (a) Per hour during 1 - 5 hour experiments (b) Between 2 experimental days on the same electrode.

References

    1. Santhanam G, Ryu SI, Yu BM, Afshar A, Shenoy KV. A high-performance brain-computer interface. Nature. 2006;442:195–198. - PubMed
    1. Taylor DM, Tillery S.I. Helms, Schwartz AB. Direct cortical control of 3D neuroprosthetic devices. Science. 2002;296:1829–1832. - PubMed
    1. Serruya MD, Hatsopoulos NG, Paninski L, Fellows MR, Donoghue JP. Instant neural control of a movement signal. Nature. 2002;416:141–142. - PubMed
    1. Carmena JM, Lebedev MA, Crist RE, O’Doherty JE, Santucci DM, Dimitrov DF, Patil PG, Henriquez CS, Nicolelis MAL. Learning to control a brain-machine interface for reaching and grasping by primates. PLoS Biology. 2003;1:193–208. - PMC - PubMed
    1. Lebedev MA, Carmena JM, O’Doherty JE, Zacksenhouse M, Henriquez CS, Principe JC, Nicolelis MAL. Cortical ensemble adaptation to represent velocity of an artificial actuator controlled by a brain-machine interface. J Neurosci. 2005;25(19):4681–4693. - PMC - PubMed

Publication types