

Recombination rates in admixed individuals identified by ancestry-based inference
- PMID: 21775992
- PMCID: PMC8582322
- DOI: 10.1038/ng.894
Recombination rates in admixed individuals identified by ancestry-based inference
Abstract
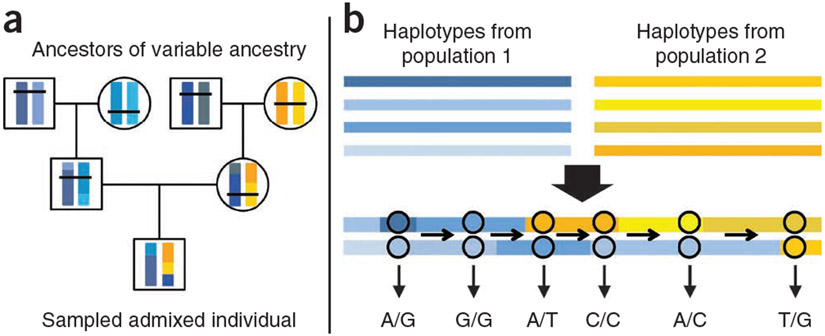
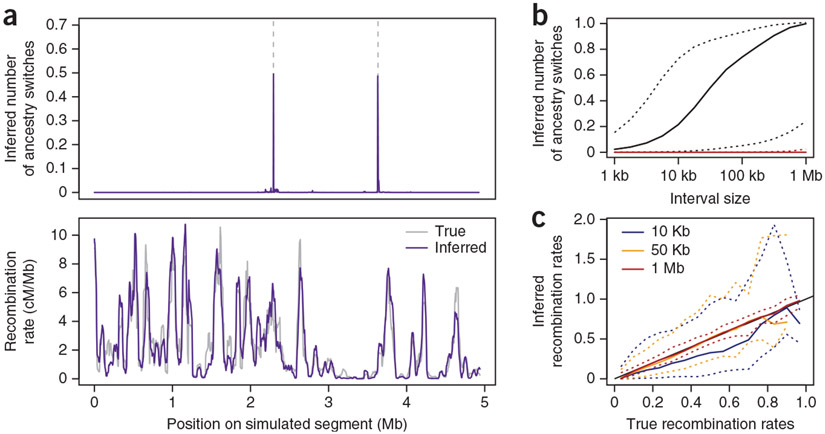
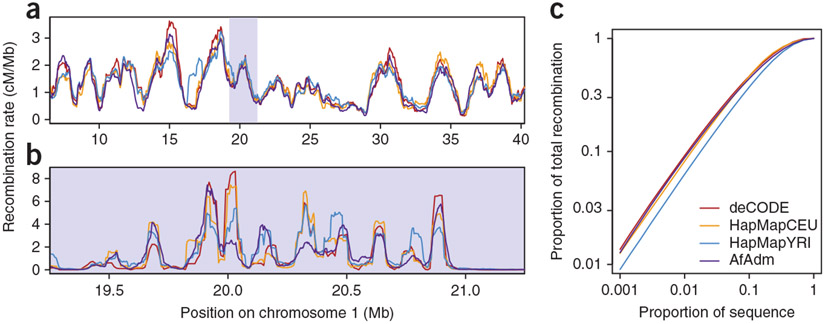
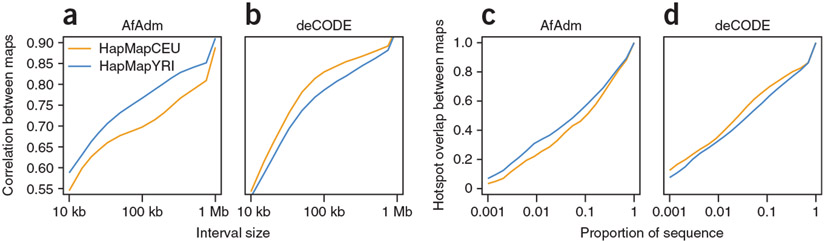
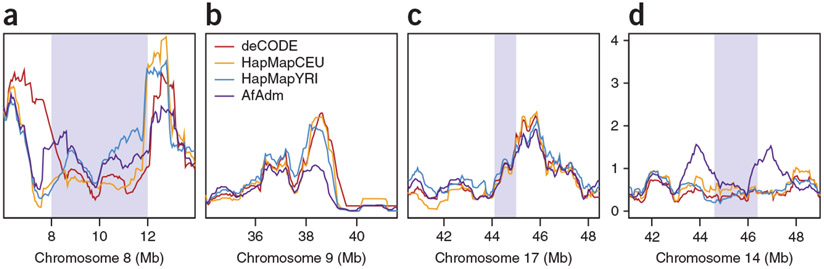
Studies of recombination and how it varies depend crucially on accurate recombination maps. We propose a new approach for constructing high-resolution maps of relative recombination rates based on the observation of ancestry switch points among admixed individuals. We show the utility of this approach using simulations and by applying it to SNP genotype data from a sample of 2,565 African Americans and 299 African Caribbeans and detecting several hundred thousand recombination events. Comparison of the inferred map with high-resolution maps from non-admixed populations provides evidence of fine-scale differentiation in recombination rates between populations. Overall, the admixed map is well predicted by the average proportion of admixture and the recombination rate estimates from the source populations. The exceptions to this are in areas surrounding known large chromosomal structural variants, specifically inversions. These results suggest that outside of structurally variable regions, admixture does not substantially disrupt the factors controlling recombination rates in humans.
Figures
Comment in
-
Human genetics: Recombination diversified.Nat Rev Genet. 2011 Aug 2;12(9):585. doi: 10.1038/nrg3056. Nat Rev Genet. 2011. PMID: 21808263 No abstract available.
-
Admixture provides new insights into recombination.Nat Genet. 2011 Aug 29;43(9):819-20. doi: 10.1038/ng.918. Nat Genet. 2011. PMID: 21874032 No abstract available.
References
-
- Crawford DC et al. Evidence for substantial fine-scale variation in recombination rates across the human genome. Nat. Genet 36, 700–706 (2004). - PubMed
-
- Graffelman J, Balding D, Gonzalez-Neira A & Bertranpetit J Variation in estimated recombination rates across human populations. Hum. Genet 122, 301–310 (2007). - PubMed
Publication types
MeSH terms
Grants and funding
- N01 AI050024/AI/NIAID NIH HHS/United States
- G12 RR003048/RR/NCRR NIH HHS/United States
- R01 HL087660/HL/NHLBI NIH HHS/United States
- RR03048/RR/NCRR NIH HHS/United States
- U01 HL49596/HL/NHLBI NIH HHS/United States
- R01 AI044840/AI/NIAID NIH HHS/United States
- U01 HL075417/HL/NHLBI NIH HHS/United States
- M01 RR000052/RR/NCRR NIH HHS/United States
- HL072518/HL/NHLBI NIH HHS/United States
- AI41040/AI/NIAID NIH HHS/United States
- RL1 MH083268/MH/NIMH NIH HHS/United States
- HL075417/HL/NHLBI NIH HHS/United States
- ES09606/ES/NIEHS NIH HHS/United States
- R01 HL087665/HL/NHLBI NIH HHS/United States
- HL49612/HL/NHLBI NIH HHS/United States
- R01 HL087679/HL/NHLBI NIH HHS/United States
- P01 ES009606/ES/NIEHS NIH HHS/United States
- U01 HL072433/HL/NHLBI NIH HHS/United States
- RC2 HL101651/HL/NHLBI NIH HHS/United States
- HL087699/HL/NHLBI NIH HHS/United States
- HL072433/HL/NHLBI NIH HHS/United States
- R01 HL087699/HL/NHLBI NIH HHS/United States
- AI50024/AI/NIAID NIH HHS/United States
- HL087660/HL/NHLBI NIH HHS/United States
- RC1 HL100245/HL/NHLBI NIH HHS/United States
- M01-RR00052/RR/NCRR NIH HHS/United States
- S06GM08015/GM/NIGMS NIH HHS/United States
- U01 HL072518/HL/NHLBI NIH HHS/United States
- AI44840/AI/NIAID NIH HHS/United States
- HL100245/HL/NHLBI NIH HHS/United States
- U01 HL049596/HL/NHLBI NIH HHS/United States
- R01 AI041040/AI/NIAID NIH HHS/United States
- RL1MH083268/MH/NIMH NIH HHS/United States
- R01 HL072414/HL/NHLBI NIH HHS/United States
- R18 AI044840/AI/NIAID NIH HHS/United States
- R01HL087679/HL/NHLBI NIH HHS/United States
LinkOut - more resources
Full Text Sources
Other Literature Sources
