. 2012 Feb;6(2):248-58.
doi: 10.1038/ismej.2011.95. Epub 2011 Jul 21.

Active and total microbial communities in forest soil are largely different and highly stratified during decomposition

Affiliations

Active and total microbial communities in forest soil are largely different and highly stratified during decomposition

Petr Baldrian et al. ISME J. 2012 Feb.

Abstract

Soils of coniferous forest ecosystems are important for the global carbon cycle, and the identification of active microbial decomposers is essential for understanding organic matter transformation in these ecosystems. By the independent analysis of DNA and RNA, whole communities of bacteria and fungi and its active members were compared in topsoil of a Picea abies forest during a period of organic matter decomposition. Fungi quantitatively dominate the microbial community in the litter horizon, while the organic horizon shows comparable amount of fungal and bacterial biomasses. Active microbial populations obtained by RNA analysis exhibit similar diversity as DNA-derived populations, but significantly differ in the composition of microbial taxa. Several highly active taxa, especially fungal ones, show low abundance or even absence in the DNA pool. Bacteria and especially fungi are often distinctly associated with a particular soil horizon. Fungal communities are less even than bacterial ones and show higher relative abundances of dominant species. While dominant bacterial species are distributed across the studied ecosystem, distribution of dominant fungi is often spatially restricted as they are only recovered at some locations. The sequences of cbhI gene encoding for cellobiohydrolase (exocellulase), an essential enzyme for cellulose decomposition, were compared in soil metagenome and metatranscriptome and assigned to their producers. Litter horizon exhibits higher diversity and higher proportion of expressed sequences than organic horizon. Cellulose decomposition is mediated by highly diverse fungal populations largely distinct between soil horizons. The results indicate that low-abundance species make an important contribution to decomposition processes in soils.


Figures

Figure 1
Figure 1
Properties of Picea abies forest soil, abundance of microorganisms and activity of extracellular enzymes involved in organic matter decomposition in the L and H horizons. The data represent mean values and s.d. from four studied sites.
Figure 2
Figure 2
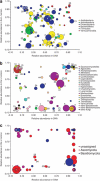
Distribution of major bacterial and fungal OTUs and cbhI clusters from Picea abies forest topsoil between the L and H horizons and between DNA and RNA. The data represent mean values from four sampling sites. Symbol areas correspond to relative abundance in the combined set of DNA and RNA sequences from both horizons. (a) Bacteria, identifications: 0=Actinoallomurus; 1=Gp1 Acidobacterium; 2=Rhodoplanes; 3=Rhodospirillales; 4=Steroidobacter; 5=Gp2 Acidobacterium; 6=Gp1 Acidobacterium; 7=Rhizobiales; 8=Gp2 Acidobacterium; 10=Gp1 Acidobacterium; 11=Frankineae; 12=Gp3 Acidobacterium; 13=Afipia; 14=Gp2 Acidobacterium; 15=Burkholderia; 16=Actinomycetales; 19=Gp3 Acidobacterium; 20=Phenylobacterium; 21=Desulfomonile; 22=Gp3 Acidobacterium; 23=Gp3 Acidobacterium; 24=Ferrithrix; 25=Acetobacteraceae; 26=Rhizobiales; 27=Gp3 Acidobacterium; 28=Gp1 Acidobacterium; 30=Gp3 Acidobacterium; 31=Acidisphaera; 32=Actinoallomurus; 33=Gp1 Acidobacterium; 34=Sporomusa; 35=Chondromyces; 36=Acetobacteraceae; 37=Steroidobacter; 38=Chitinophagaceae; 39=Caulobacteraceae; 40=Rhizobiales; 41=Mycobacterium; 48=Gp1 Acidobacterium; 59=Phenylobacterium. (b) Fungi, OTU identifications: 1=Ascomycete; 2=Tylospora fibrillosa; 3=Piloderma; 4=Piloderma; 5=Ascomycete; 6=Tylospora asterophora; 7=Cenococcum geophilum; 8=Verrucaria; 9=Hygrophorus olivaceoalbus; 10=Russula cyanoxantha; 11=Cortinarius biformis; 13=Lecanora; 14=Tylospora fibrillosa; 18=Cladophialophora minutissima; 20=Auriculoscypha; 22=Inocybe; 23=Ascomycete; 24=Basidiomycete; 25=Ascomycete; 27=Cryptococcus podzolicus; 28=Mycocentrospora acerina; 29=Ascomycete; 30=Ascomycete; 32=Meliniomyces vraolstadiae; 33=Amanita spissa; 44=Phellopilus; 45=Chytridiomycete; 47=Alternaria alternata; 49=Cenococcum geophilum; 50=Cortinarius gentilis; 52=Piloderma; 55=Neofusicoccum; 60=Russula cyanoxantha; 62=Trichosporon porosum; 67=Pseudotomentella; 69=Russula cyanoxantha; 70=Mycoarthris; 88=Elaphocordyceps; 94=Tomentella sublilacina. (c) cbhI, clusters with sequence similarities to genes of known cbhI producers: 0=Mycena; 1=Xylariales spp.; 16=Phacidium; 18=Mycena; 25=Phacidium; 28=Xylariales spp.; 42=Phialophora; 53=Xylariales spp.; 72=Phialophora; 75=Ceuthospora and 84=Phialophora sp.
Figure 3
Figure 3
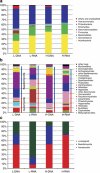
Phylogenetic assignment of bacterial, fungal and cbhI sequences from Picea abies forest topsoil. The data represent mean values from four study sites. (a) Bacteria, (b) fungi and (c) cbhI sequences.
Figure 4
Figure 4
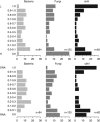
Distribution of bacterial and fungal OTUs and cbhI clusters from Picea abies forest soil among the L and H horizons and among DNA and RNA, in percents. Based on the data for OTUs/clusters with abundance >0.1%. The y axis represents relative share of transcripts in the L horizon or in the DNA. The values 0.0 and 1.0 represent OTUs/clusters present only in either the H or L horizon, in RNA or in the DNA.
Figure 5
Figure 5
Number of sites in the Picea abies forest soil where DNA of dominant bacterial and fungal OTUs and cbhI clusters were detected. Only OTUs/clusters with abundance >0.3% in the DNA were considered; n=50 for bacteria, n=54 for fungi and n=56 for cbhI. To correct for the same sampling depth, 350 sequences of each target were randomly selected from each sample.
Figure 6
Figure 6
Diversity of amino-acid composition and frequency of alternative amino acids over the length of a cbhI internal peptide obtained by translation of the 62 most abundant cbhI sequences detected in Picea abies forest soil. Abundance of alternative amino acids at each position is colour coded; the identity of the most abundant amino acid at each position is indicated, and consensus amino acids (>75%) are highlighted.

References

    1. Altschul SF, Madden TL, Schäffer AA, Zhang J, Zhang Z, Miller W, et al. Gapped BLAST and PSI-BLAST: a new generation of protein database search programs. Nucleic Acids Res. 1997;25:3389–3402. - PMC - PubMed
    1. Amann RI, Ludwig W, Schleifer KH. Phylogenetic identification and in situ detection of individual microbial cells without cultivation. Microbiol Rev. 1995;59:143–169. - PMC - PubMed
    1. Anderson IC, Parkin PI. Detection of active soil fungi by RT-PCR amplification of precursor rRNA molecules. J Microbiol Methods. 2007;68:248–253. - PubMed
    1. Bååth E, Anderson TH. Comparison of soil fungal/bacterial ratios in a pH gradient using physiological and PLFA-based techniques. Soil Biol Biochem. 2003;35:955–963.
    1. Bailey VL, Smith JL, Bolton H. Fungal-to-bacterial ratios in soils investigated for enhanced C sequestration. Soil Biol Biochem. 2002;34:997–1007.

Publication types