

Bioimaging analysis of nuclear factor-κB activity in Philadelphia chromosome-positive acute lymphoblastic leukemia cells reveals its synergistic upregulation by tumor necrosis factor-α-stimulated changes to the microenvironment
- PMID: 21777350
- PMCID: PMC11158770
- DOI: 10.1111/j.1349-7006.2011.02039.x
Bioimaging analysis of nuclear factor-κB activity in Philadelphia chromosome-positive acute lymphoblastic leukemia cells reveals its synergistic upregulation by tumor necrosis factor-α-stimulated changes to the microenvironment
Abstract
To gain an insight into the microenvironmental regulation of nuclear factor (NF)-κB activity in the progression of leukemia, we established a bioluminescent imaging model of Philadelphia chromosome-positive acute lymphoblastic leukemia (Ph+ALL) cells transduced with a NF-κB/luciferase (Luc) reporter and cocultured with murine stromal cells and cytokines. Stromal cells alone did not augment Luc activity, taken as an index of NF-κB, but Luc activity was synergistically upregulated by the combination of stromal cells and tumor necrosis factor (TNF)-α. Dehydroxymethylepoxyquinomicin (DHMEQ), a specific inhibitor of NF-κB DNA binding, rapidly induced the apoptosis of Ph+ALL cells, indicating that NF-κB is necessary for the growth and survival of these cells. However, the DHMEQ-induced suppression of NF-κB activity and the apoptosis of leukemia cells were attenuated by the presence of stromal cells and TNF-α. In NOD-SCID mice transplanted with NF-κB/Luc reporter-containing Ph+ALL cell lines and monitored periodically during the progression of the leukemia, murine TNF-α was significantly expressed in lesions in which the leukemia cells emitted a significant NF-κB signal. These results support the notion that TNF-α also triggers microenvironmental upregulation of NF-κB activity in vivo. Collectively, the results indicated that TNF-α-stimulated microenvironment may contribute to the survival and progression of Ph+ALL cells through the synergistic upregulation of NF-κB activity.
© 2011 Japanese Cancer Association.
Figures

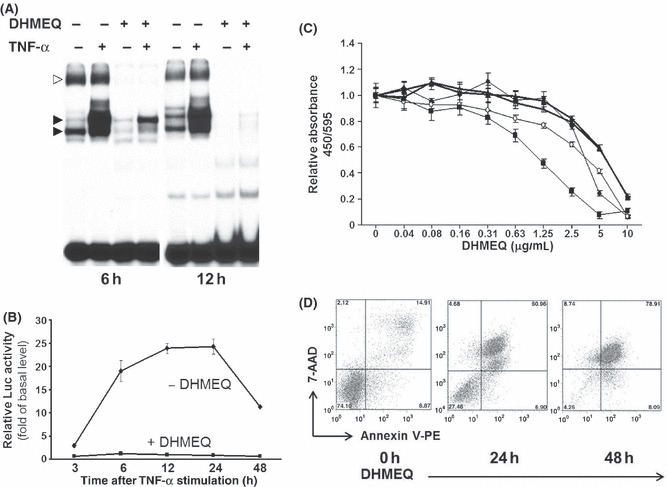

 ), 0.1 μM imatinib; (▪), 1 μM imatinib; (
 ), 10 μM imatinib. These IMS‐PhL1 cells were treated with or without TNF‐α, as indicated, and the Luc activity of IMS‐PhL1 cells cultured in the absence of HESS5 and TNF‐α was used as the basal level. The EF1α/Luc activity in IMS‐PhL1 cells treated with 0.1 μM of imatinib and 100 ng/mL of TNF‐α, and in the absence and presence of HESS5, differed significantly (P < 0.05). The assays in (C,D) were conducted in triplicate and data were analyzed using Student’s t‐test. Data show the mean ± SEM.

Similar articles
-
Microenvironmental stromal cells abrogate NF-κB inhibitor-induced apoptosis in chronic lymphocytic leukemia.Haematologica. 2018 Jan;103(1):136-147. doi: 10.3324/haematol.2017.165381. Epub 2017 Nov 9. Haematologica. 2018. PMID: 29122993 Free PMC article.
-
Inhibition of tumor necrosis factor-alpha -induced nuclear translocation and activation of NF-kappa B by dehydroxymethylepoxyquinomicin.J Biol Chem. 2002 Jul 5;277(27):24625-30. doi: 10.1074/jbc.M112063200. Epub 2002 Apr 30. J Biol Chem. 2002. PMID: 11983688
-
Bone marrow stromal cells and the upregulation of interleukin-8 production in human T-cell acute lymphoblastic leukemia through the CXCL12/CXCR4 axis and the NF-kappaB and JNK/AP-1 pathways.Haematologica. 2008 Apr;93(4):524-32. doi: 10.3324/haematol.12098. Epub 2008 Mar 5. Haematologica. 2008. PMID: 18322253
-
Molecular design and biological activities of NF-kappaB inhibitors.Mol Cells. 2002 Oct 31;14(2):163-7. Mol Cells. 2002. PMID: 12442886 Review.
-
Possible role of peritoneal NF-κB in peripheral inflammation and cancer: lessons from the inhibitor DHMEQ.Biomed Pharmacother. 2011 Jul;65(4):252-9. doi: 10.1016/j.biopha.2011.02.003. Epub 2011 Apr 8. Biomed Pharmacother. 2011. PMID: 21723080 Review.
Cited by
-
The impact of inflammation and cytokine expression of PM2.5 in AML.Oncol Lett. 2018 Aug;16(2):2732-2740. doi: 10.3892/ol.2018.8965. Epub 2018 Jun 13. Oncol Lett. 2018. PMID: 30013668 Free PMC article.
-
THBS1 Is a Novel Serum Prognostic Factors of Acute Myeloid Leukemia.Front Oncol. 2020 Feb 7;9:1567. doi: 10.3389/fonc.2019.01567. eCollection 2019. Front Oncol. 2020. PMID: 32117788 Free PMC article.
-
Serum Tumor Necrosis Factor-Alpha Levels in Acute Leukemia and Its Prognostic Significance.Cureus. 2022 May 8;14(5):e24835. doi: 10.7759/cureus.24835. eCollection 2022 May. Cureus. 2022. PMID: 35547942 Free PMC article.
-
Insights into the mechanism of Arnebia euchroma on leukemia via network pharmacology approach.BMC Complement Med Ther. 2020 Oct 27;20(1):322. doi: 10.1186/s12906-020-03106-z. BMC Complement Med Ther. 2020. PMID: 33109189 Free PMC article.
-
Beyond Corticoresistance, A Paradoxical Corticosensitivity Induced by Corticosteroid Therapy in Pediatric Acute Lymphoblastic Leukemias.Cancers (Basel). 2023 May 18;15(10):2812. doi: 10.3390/cancers15102812. Cancers (Basel). 2023. PMID: 37345151 Free PMC article. Review.
References
-
- Ghosh S, May MJ, Kopp EB. NF‐κB and Rel proteins: evolutionarily conserved mediators of immune responses. Annu Rev Immunol 1998; 16: 225–60. - PubMed
-
- Verma IM, Stevenson JK, Schwarz EM, Van Antwerp D, Miyamoto S. Rel/NF‐κB/IκB family: intimate tales of association and dissociation. Genes Dev 1995; 9: 2723–35. - PubMed
-
- Akira S, Uematsu S, Takeuchi O. Pathogen recognition and innate immunity. Cell 2006; 124: 783–801. - PubMed
-
- Karin M, Lawrence T, Nizet V. Innate immunity gone awry: linking microbial infections to chronic inflammatory disorders and cancer. Cell 2006; 124: 823–35. - PubMed
-
- Rayet B, Gélinas C. Aberrant rel/nfκb genes and activity in human cancer. Oncogene 1999; 18: 6938–69. - PubMed
Publication types
MeSH terms
Substances
LinkOut - more resources
Full Text Sources
Other Literature Sources
