. 2011 Jul 21:10:87.
doi: 10.1186/1476-4598-10-87.

Role of tissue transglutaminase 2 in the acquisition of a mesenchymal-like phenotype in highly invasive A431 tumor cells

Affiliations

Role of tissue transglutaminase 2 in the acquisition of a mesenchymal-like phenotype in highly invasive A431 tumor cells

Chun-Yu Lin et al. Mol Cancer. .

Abstract

Background: Cancer progression is closely linked to the epithelial-mesenchymal transition (EMT) process. Studies have shown that there is increased expression of tissue tranglutaminase (TG2) in advanced invasive cancer cells. TG2 catalyzes the covalent cross-linking of proteins, exhibits G protein activity, and has been implicated in the modulation of cell adhesion, migration, invasion and cancer metastasis. This study explores the molecular mechanisms associated with TG2's involvement in the acquisition of the mesenchymal phenotype using the highly invasive A431-III subline and its parental A431-P cells.

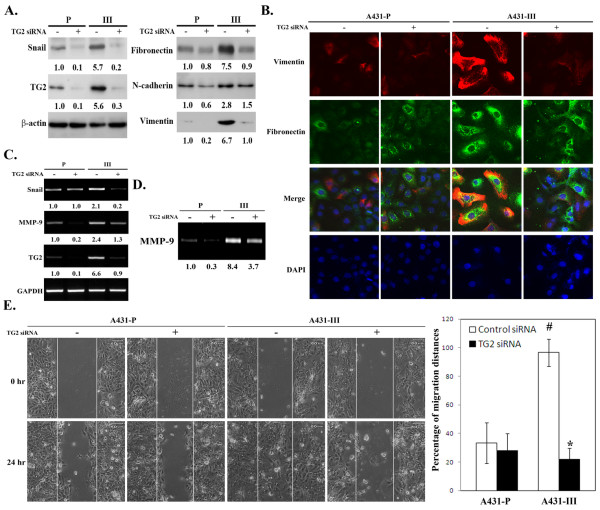
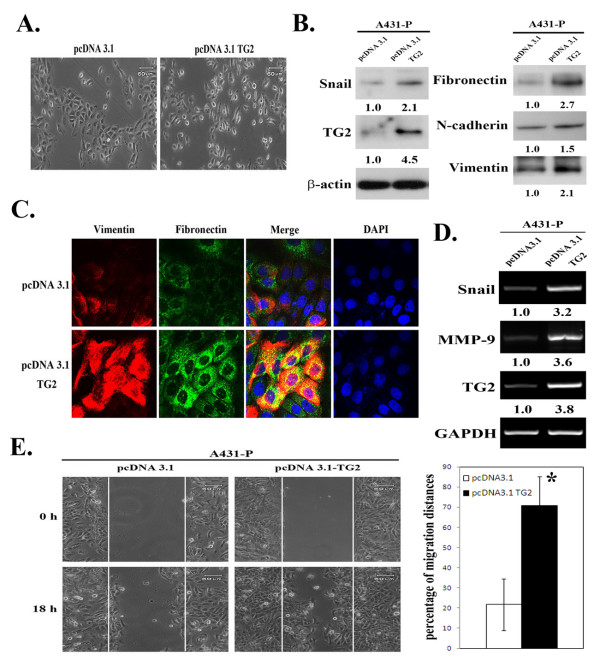
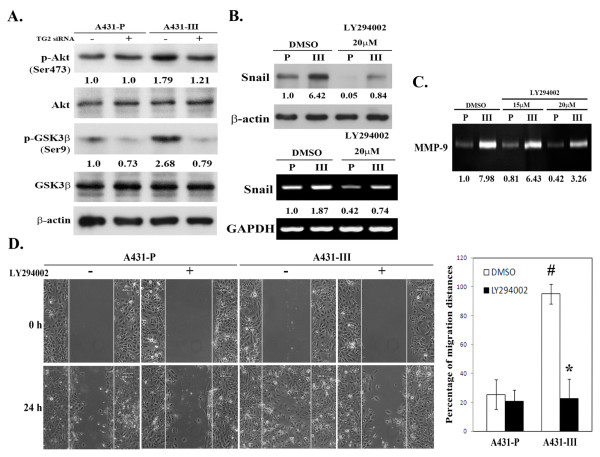
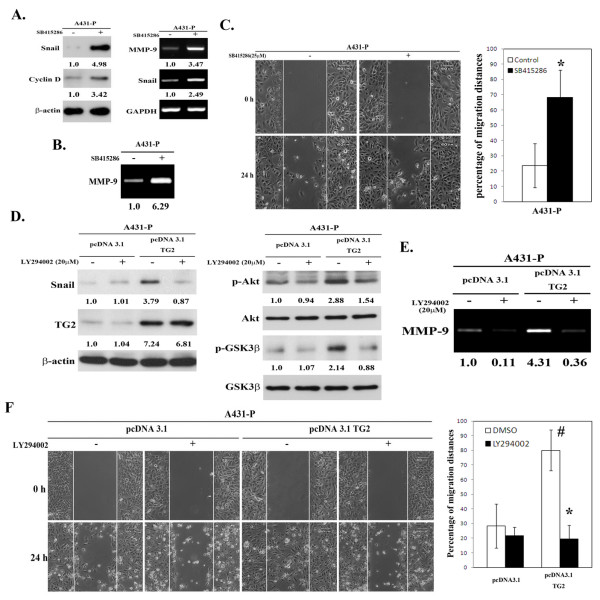
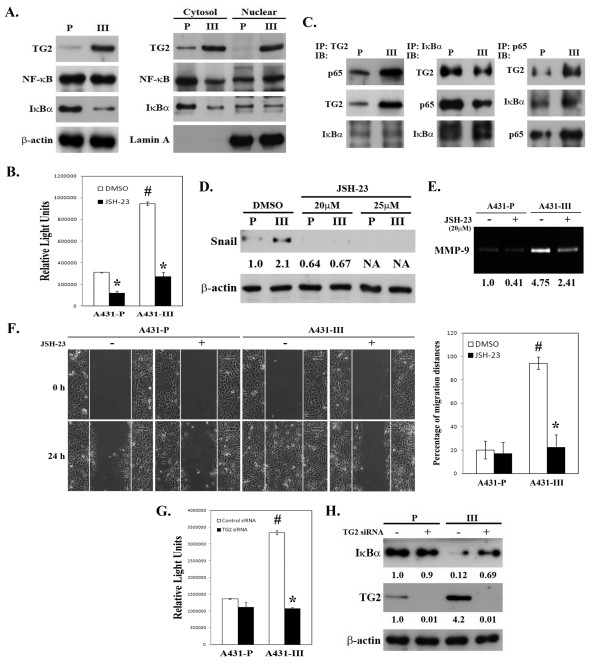
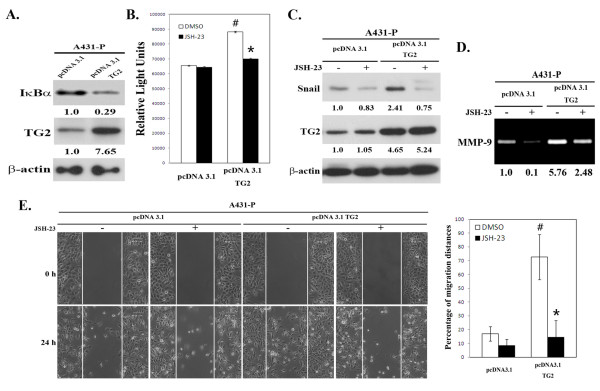
Results: The A431-III tumor subline displays increased expression of TG2. This is accompanied by enhanced expression of the mesenchymal phenotype, and this expression is reversed by knockdown of endogenous TG2. Consistent with this, overexpression of TG2 in A431-P cells advanced the EMT process. Furthermore, TG2 induced the PI3K/Akt activation and GSK3β inactivation in A431 tumor cells and this increased Snail and MMP-9 expression resulting in higher cell motility. TG2 also upregulated NF-κB activity, which also enhanced Snail and MMP-9 expression resulting in greater cell motility; interestingly, this was associated with the formation of a TG2/NF-κB complex. TG2 facilitated acquisition of a mesenchymal phenotype, which was reversed by inhibitors of PI3K, GSK3 and NF-κB.

Conclusions: This study reveals that TG2 acts, at least in part, through activation of the PI3K/Akt and NF-κB signaling systems, which then induce the key mediators Snail and MMP-9 that facilitate the attainment of a mesenchymal phenotype. These findings support the possibility that TG2 is a promising target for cancer therapy.


Figures

Figure 1
Figure 1
Effect of TG2 knockdown on mesenchymal markers in A431-P and A431-III cells. (A) The cells were treated with 40 nM of TG2-specific siRNA or control siRNA. At 48 h post-transfection, cell lysates were prepared and subjected to immunoblotting analysis for TG2, Snail fibronectin, N-cadherin, vimentin and β-actin served as internal controls. (B) The cells were plated onto non-fibronectin-coated cover slips in six-well plate for 24 h. The cells were treated with 40 nM of TG2 siRNA or control siRNA, and then immuno-stained for fibronectin (green) and vimentin (red) with the nuclei stained with DAPI (blue). The fluorescence images were visualized using confocal microscopy. (C) Total RNA was extracted at 48 h after siRNA transfection and analyzed for TG2, Snail and MMP-9 by RT-PCR with GAPDH served as the internal control. (D) The culture conditioned media of TG2-silenced cells were collected and normalized by cell numbers prior to gelatin zymography analysis. (E) After TG2 knockdown, a wound healing assay was performed by scratching the cell layer with a pipette tip, and phase-contrast images were taken at 0 h and 24 h later to assess cell migration into the open space. Quantitative data are presented as the mean (± SD) percentage of migration distance (n = 20). * and # indicate a significant difference compared with the respective control (p <0.05).
Figure 2
Figure 2
Effect of TG2 over-expression on mesenchymal-like phenotype in A431-P cells. (A) Phase-contrast images of empty vector (pcDNA3.1) or full length TG2 (pcDNA3.1-TG2)-transfected cells cultured on six-wells plates in culture medium containing 10% FBS (×100 magnification). At 48 h post-transfection, (B) cell lysates were prepared and subjected to immunoblotting analysis for TG2, Snail, fibronectin, N-cadherin, and vimentin. (C) Cells were immuno-stained for fibronectin (green) and vimentin (red) as well as having DAPI (blue) staining of the nuclei. The fluorescence images were visualized by confocal microscopy. (D) Total mRNA was extracted and analyzed for TG2, Snail and MMP-9 by RT-PCR. (E) Cell migratory activity was determined using the wound healing assay as described in figure 1. Quantitative data are presented as the mean (± SD) percentage of migration distance (n = 20). * indicates a significant difference compared with the control (p <0.05).
Figure 3
Figure 3
Positive association of PI3K/Akt-GSK-3β signaling activation with the EMT phenotype in A431-P and A431-III cells. (A) Cells were treated with 40 nM of control or specific TG2 siRNA. Cellular activity of Akt and GSK-3β were determined by analyzing their phosphorylation status using immunoblotting. (B-D) Cells were treated with 20 μM Akt inhibitor LY294002 for 24 h. (B) The cellular protein and RNA levels of Snail were respectively determined by immunoblotting and RT-PCR. (C) The secreted activity of MMP-9 was measured using gelatin zymography. (D) Cell migratory activity was determined by wound healing assay. Quantitative data are presented as the mean (± SD) percentage of migration distance (n = 20). * indicates a significant difference compared with the respective control (p <0.05). # indicates a significant difference compared with the A431-P (p < 0.05).
Figure 4
Figure 4
Upregulation of PI3K/Akt-GSK-3β signaling activation is associated with the EMT phenotype in TG2-overexpressing A431-P cells. (A-C) The cells were treated with 25 μM of the specific GSK3 inhibitor SB415286 for 48 h. (A) The cellular protein and RNA levels of Snail and MMP-9 were respectively determined by immunoblotting and RT-PCR. Cyclin D served as the indicator of the inhibition of GSK-3β activity. (B) The secreted MMP-9 activity was detected using gelatin zymography. (C) Cell migratory activity was determined by the wound healing assay. Quantitative data are presented as the mean (± SD) percentage of migration distance (n = 20). (D-F) A431-P cells were transfected with empty pcDNA3.1 vector or pcDNA3.1-TG2, and then treated with 20 μM of PI3K inhibitor LY294002 for 24 h. (D) Cell lysates were analyzed for phosphorylated Akt, GSK-3β, Snail and TG2 using immunoblotting. (E) The secreted activity of MMP-9 was detected by gelatin zymography. (F) Cell migratory activity was determined using the wound healing assay. Quantitative data are presented as the mean (± SD) percentage of migration distance (n = 20). * indicates a significant difference compared with the respective control (p <0.05). # indicates a significant difference compared with the A431-P (p < 0.05).
Figure 5
Figure 5
Positive association of GSK-3β activity with TG2 and the EMT phenotype in A431-P and A431-III cells. (A) Total cell lysates and cytosolic and nuclear extracts were prepared and analyzed for TG2, NF-κB, and IκBα by immunoblotting. (B) Cells were treated with 25 μM of JSH-23 for 24 h, and the cellular NF-κB of activity was determined using a luciferase reporter assay. (C) The interaction of TG2, NF-κB, and IκBα in A431-P and the A431-III sub-line. (D-E) Cells were treated with 20 or 25 μM of JSH-23 for 24 h, and cell lysates were analyzed for Snail by immunoblotting, and the conditioned media was analyzed for MMP-9 activity by gelatin zymography. (F) Cells were treated with 25 μM of JSH-23 for 24 h, and analyzed for migratory activity using wound healing assay. Quantitative data are presented as the mean (± SD) percentage of migration distance (n = 20). (G) Cells were transfected with control or specific TG2 siRNA, and cellular NF-κB activity was determined using a luciferase reporter assay. * indicates a significant difference compared with the respective control (p < 0.05). # indicates a significant difference compared with the A431-P (p < 0.05). (H) Cellular protein levels of IκBα and TG2 were detected by immunoblotting.
Figure 6
Figure 6
Upregulation of NF-κB activity is associated with the EMT phenotype in TG2-overexpressed A431-P cells. (A) A431-P cells were transfected with empty pcDNA3.1 vector or pcDNA3.1-TG2. Cellular protein levels of IκBα and TG2 were determined at 48 h post-transfection by immunoblotting. (B-E) Cells were treated with or without 25 μM of specific NF-κB inhibitor JSH-23 for 24 h. (B) Cellular NF-κB activity was determined using a luciferase reporter assay. (C) Cellular protein levels of Snail and TG2 were detected by immunoblotting. (D) The secreted activity of MMP-9 was analyzed by gelatin zymography. (E) Cell migratory activity was determined using a wound healing assay. Quantitative data are presented as the mean (± SD) percentage of migration distance (n = 20). * indicates a significant difference compared with the respective control (p < 0.05). # indicates a significant difference compared with the A431-P (p < 0.05).

Similar articles

Cited by

References

    1. Thiery JP. Epithelial-mesenchymal transitions in tumour progression. Nat Rev Cancer. 2002;10:442–454. doi: 10.1038/nrc822. - DOI - PubMed
    1. Thiery JP. Epithelial-mesenchymal transitions in development and pathologies. Curr Opin Cell Biol. 2003;10:740–746. doi: 10.1016/j.ceb.2003.10.006. - DOI - PubMed
    1. Yilmaz M, Christofori G. EMT, the cytoskeleton, and cancer cell invasion. Cancer Metastasis Rev. 2009;10:15–33. doi: 10.1007/s10555-008-9169-0. - DOI - PubMed
    1. Iwatsuki M, Mimori K, Yokobori T, Ishi H, Beppu T, Nakamori S, Baba H, Mori M. Epithelial-mesenchymal transition in cancer development and its clinical significance. Cancer Sci. 2010;10:293–299. doi: 10.1111/j.1349-7006.2009.01419.x. - DOI - PMC - PubMed
    1. Huber MA, Kraut N, Beug H. Molecular requirements for epithelial-mesenchymal transition during tumor progression. Curr Opin Cell Biol. 2005;10:548–558. doi: 10.1016/j.ceb.2005.08.001. - DOI - PubMed

Publication types

MeSH terms