

Transcriptional responses of the nerve agent-sensitive brain regions amygdala, hippocampus, piriform cortex, septum, and thalamus following exposure to the organophosphonate anticholinesterase sarin
- PMID: 21777430
- PMCID: PMC3180277
- DOI: 10.1186/1742-2094-8-84
Transcriptional responses of the nerve agent-sensitive brain regions amygdala, hippocampus, piriform cortex, septum, and thalamus following exposure to the organophosphonate anticholinesterase sarin
Abstract
Background: Although the acute toxicity of organophosphorus nerve agents is known to result from acetylcholinesterase inhibition, the molecular mechanisms involved in the development of neuropathology following nerve agent-induced seizure are not well understood. To help determine these pathways, we previously used microarray analysis to identify gene expression changes in the rat piriform cortex, a region of the rat brain sensitive to nerve agent exposure, over a 24-h time period following sarin-induced seizure. We found significant differences in gene expression profiles and identified secondary responses that potentially lead to brain injury and cell death. To advance our understanding of the molecular mechanisms involved in sarin-induced toxicity, we analyzed gene expression changes in four other areas of the rat brain known to be affected by nerve agent-induced seizure (amygdala, hippocampus, septum, and thalamus).
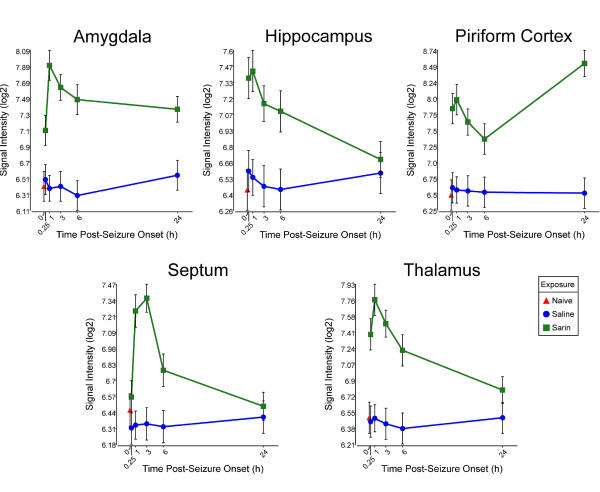
Methods: We compared the transcriptional response of these four brain regions to sarin-induced seizure with the response previously characterized in the piriform cortex. In this study, rats were challenged with 1.0 × LD₅₀ sarin and subsequently treated with atropine sulfate, 2-pyridine aldoxime methylchloride, and diazepam. The four brain regions were collected at 0.25, 1, 3, 6, and 24 h after seizure onset, and total RNA was processed for microarray analysis.
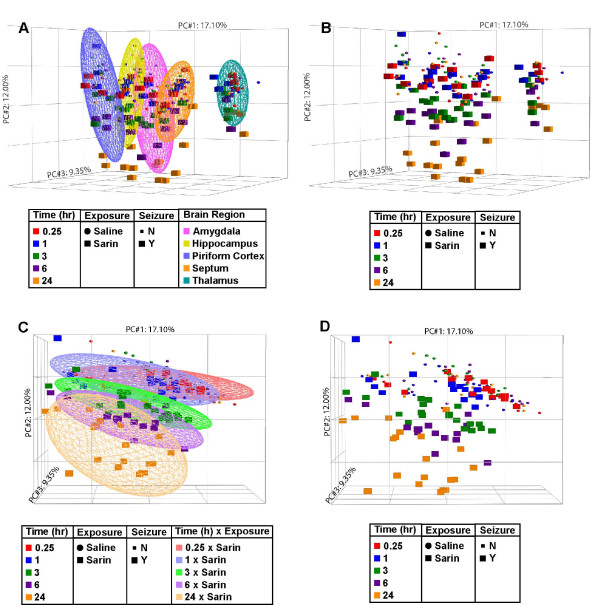
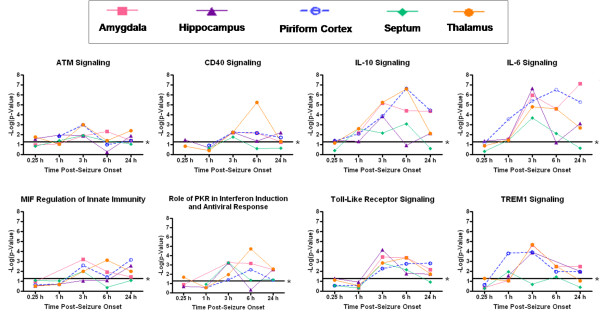
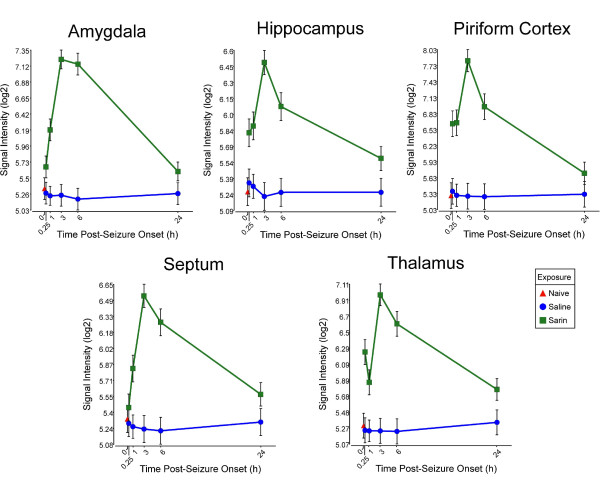
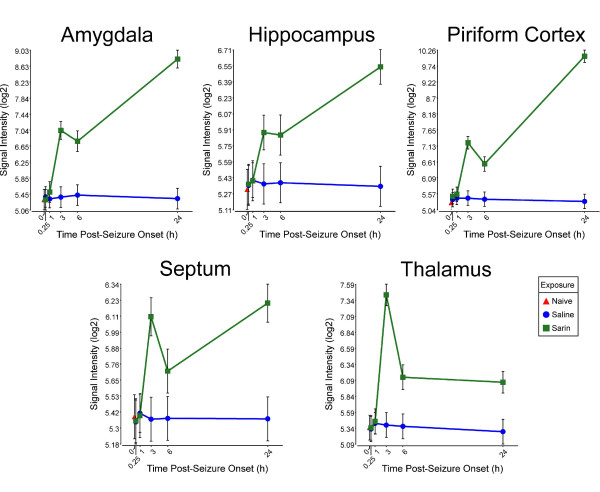
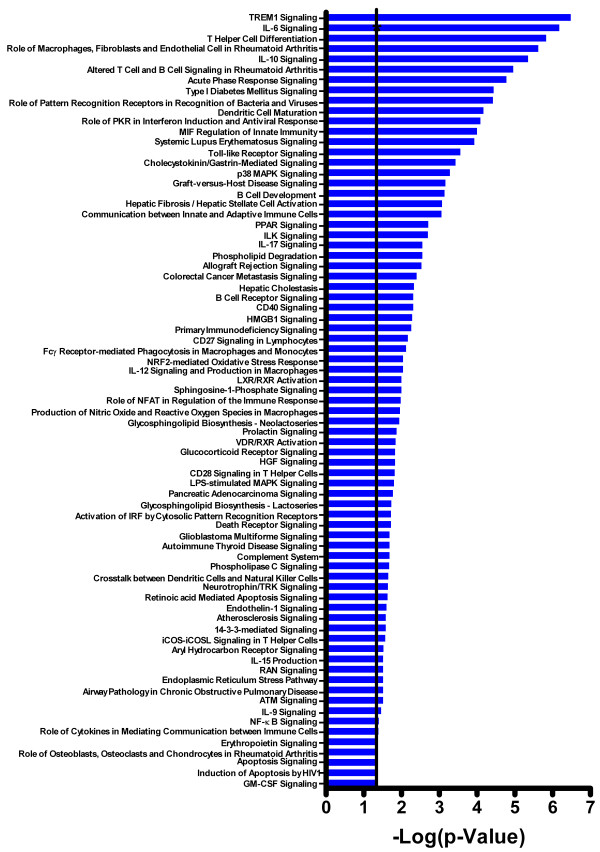
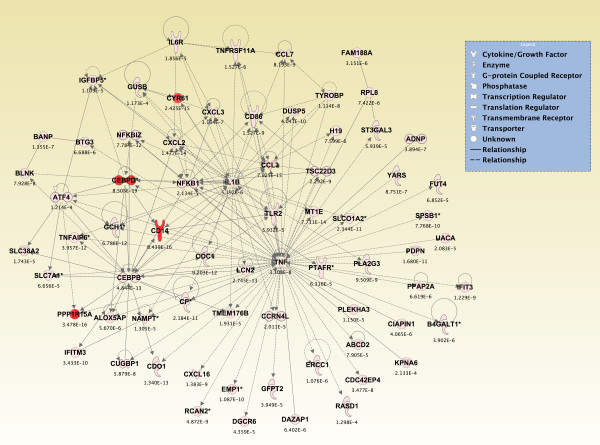
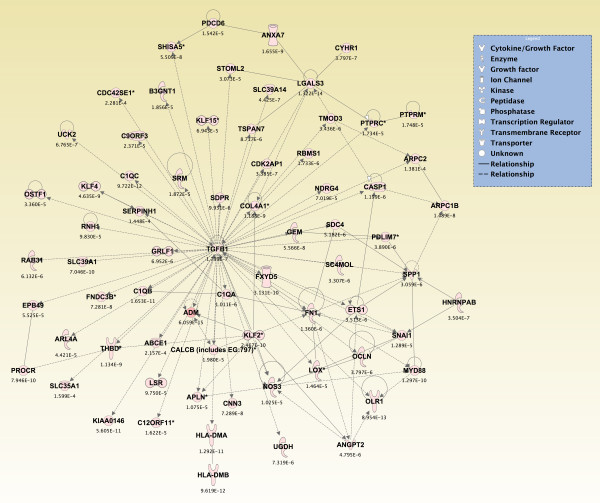
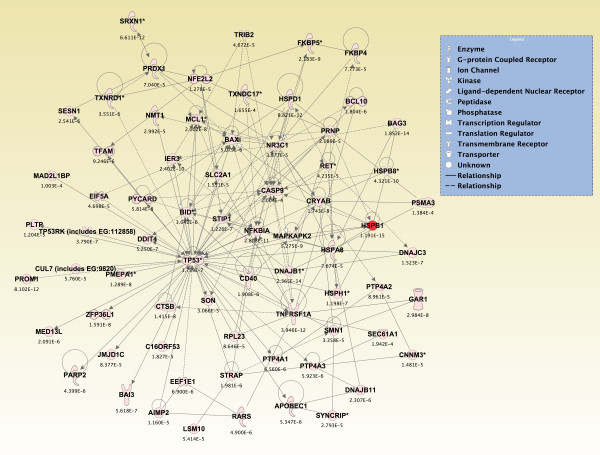
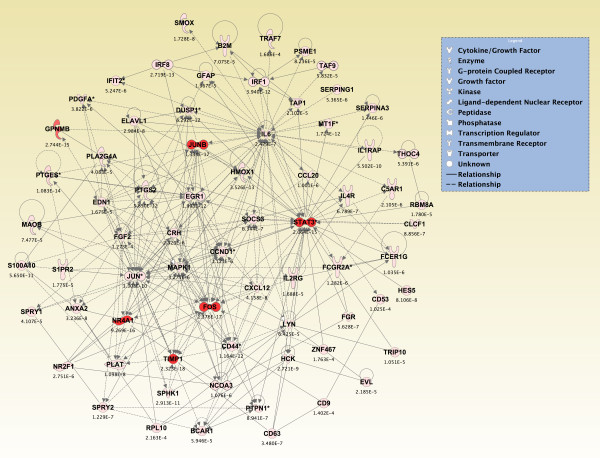
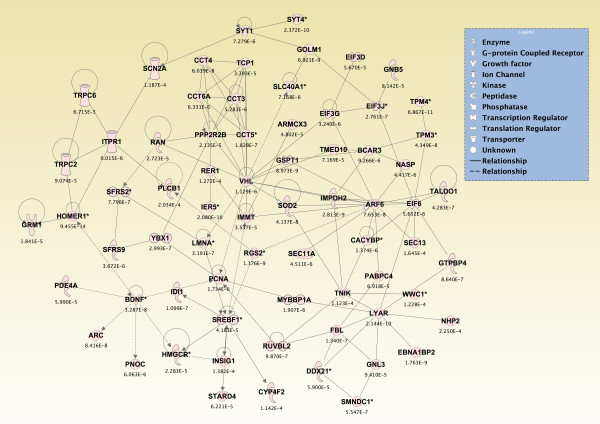
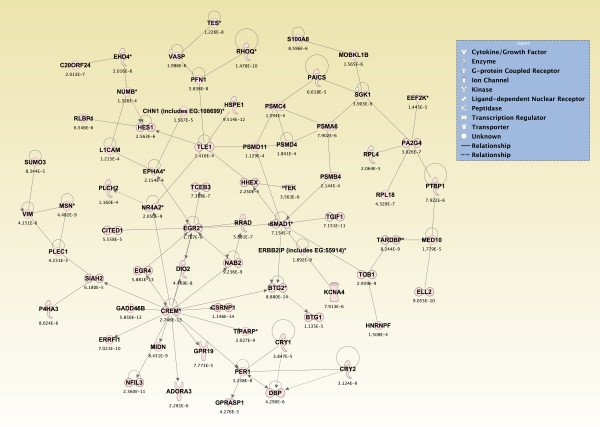
Results: Principal component analysis identified brain region and time following seizure onset as major sources of variability within the dataset. Analysis of variance identified genes significantly changed following sarin-induced seizure, and gene ontology analysis identified biological pathways, functions, and networks of genes significantly affected by sarin-induced seizure over the 24-h time course. Many of the molecular functions and pathways identified as being most significant across all of the brain regions were indicative of an inflammatory response. There were also a number of molecular responses that were unique for each brain region, with the thalamus having the most distinct response to nerve agent-induced seizure.
Conclusions: Identifying the molecular mechanisms involved in sarin-induced neurotoxicity in these sensitive brain regions will facilitate the development of novel therapeutics that can potentially provide broad-spectrum protection in five areas of the central nervous system known to be damaged by nerve agent-induced seizure.
Figures
Similar articles
-
Transcriptional analysis of rat piriform cortex following exposure to the organophosphonate anticholinesterase sarin and induction of seizures.J Neuroinflammation. 2011 Jul 21;8:83. doi: 10.1186/1742-2094-8-83. J Neuroinflammation. 2011. PMID: 21777429 Free PMC article.
-
Seizure duration following sarin exposure affects neuro-inflammatory markers in the rat brain.Neurotoxicology. 2006 Mar;27(2):277-83. doi: 10.1016/j.neuro.2005.11.009. Epub 2006 Jan 6. Neurotoxicology. 2006. PMID: 16406030
-
Organophosphorus nerve agents-induced seizures and efficacy of atropine sulfate as anticonvulsant treatment.Pharmacol Biochem Behav. 1999 Sep;64(1):147-53. doi: 10.1016/s0091-3057(99)00114-8. Pharmacol Biochem Behav. 1999. PMID: 10495009
-
Sarin (GB, O-isopropyl methylphosphonofluoridate) neurotoxicity: critical review.Crit Rev Toxicol. 2016 Nov;46(10):845-875. doi: 10.1080/10408444.2016.1220916. Epub 2016 Oct 5. Crit Rev Toxicol. 2016. PMID: 27705071 Free PMC article. Review.
-
Pathophysiological and clinical aspects of combat anticholinesterase poisoning.Br Med Bull. 2005 Apr 21;72:119-33. doi: 10.1093/bmb/ldh038. Print 2004. Br Med Bull. 2005. PMID: 15845747 Review.
Cited by
-
TSPO PET Using [18F]PBR111 Reveals Persistent Neuroinflammation Following Acute Diisopropylfluorophosphate Intoxication in the Rat.Toxicol Sci. 2019 Aug 1;170(2):330-344. doi: 10.1093/toxsci/kfz096. Toxicol Sci. 2019. PMID: 31087103 Free PMC article.
-
The role of glutamate and the immune system in organophosphate-induced CNS damage.Neurotox Res. 2013 Aug;24(2):265-79. doi: 10.1007/s12640-013-9388-1. Epub 2013 Mar 27. Neurotox Res. 2013. PMID: 23532600 Review.
-
Treatment of cholinergic-induced status epilepticus with polytherapy targeting GABA and glutamate receptors.Epilepsia Open. 2023 May;8 Suppl 1(Suppl 1):S117-S140. doi: 10.1002/epi4.12713. Epub 2023 Mar 10. Epilepsia Open. 2023. PMID: 36807554 Free PMC article. Review.
-
In vivo molecular markers for pro-inflammatory cytokine M1 stage and resident microglia in trimethyltin-induced hippocampal injury.Neurotox Res. 2014 Jan;25(1):45-56. doi: 10.1007/s12640-013-9422-3. Epub 2013 Sep 4. Neurotox Res. 2014. PMID: 24002884 Free PMC article.
-
Alterations in high-order diffusion imaging in veterans with Gulf War Illness is associated with chemical weapons exposure and mild traumatic brain injury.Brain Behav Immun. 2020 Oct;89:281-290. doi: 10.1016/j.bbi.2020.07.006. Epub 2020 Jul 31. Brain Behav Immun. 2020. PMID: 32745586 Free PMC article.
References
-
- Bajgar J. Complex view on poisoning with nerve agents and organophosphates. Acta Medica (Hradec Králové) 2005;48(1):3–21. - PubMed
Publication types
MeSH terms
Substances
Grants and funding
LinkOut - more resources
Full Text Sources
Other Literature Sources
