. 2011 Sep;179(3):1373-84.
doi: 10.1016/j.ajpath.2011.05.047. Epub 2011 Jul 21.

Reactive glia not only associates with plaques but also parallels tangles in Alzheimer's disease

Affiliations

Reactive glia not only associates with plaques but also parallels tangles in Alzheimer's disease

Alberto Serrano-Pozo et al. Am J Pathol. 2011 Sep.

Abstract

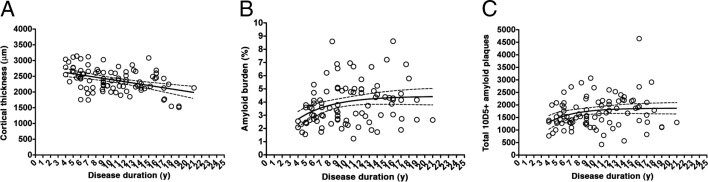
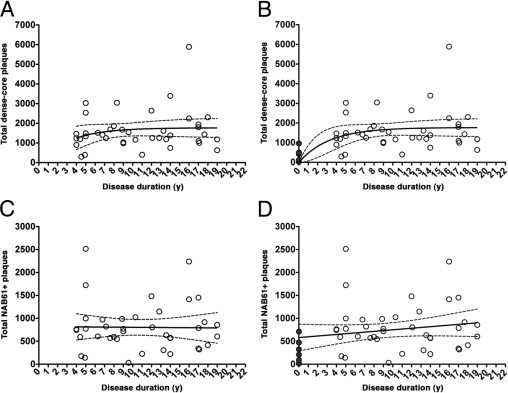
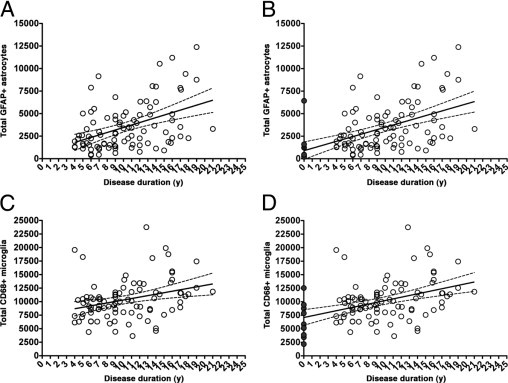
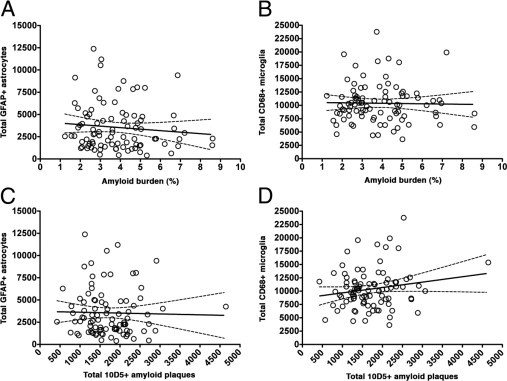
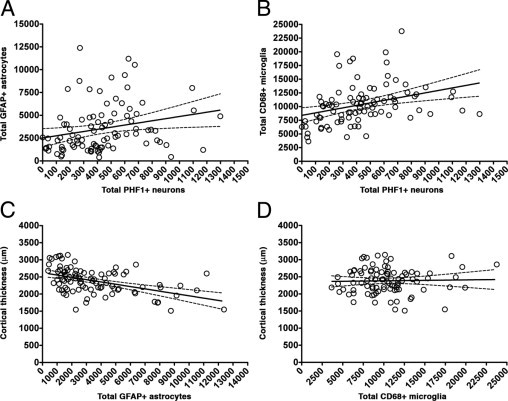
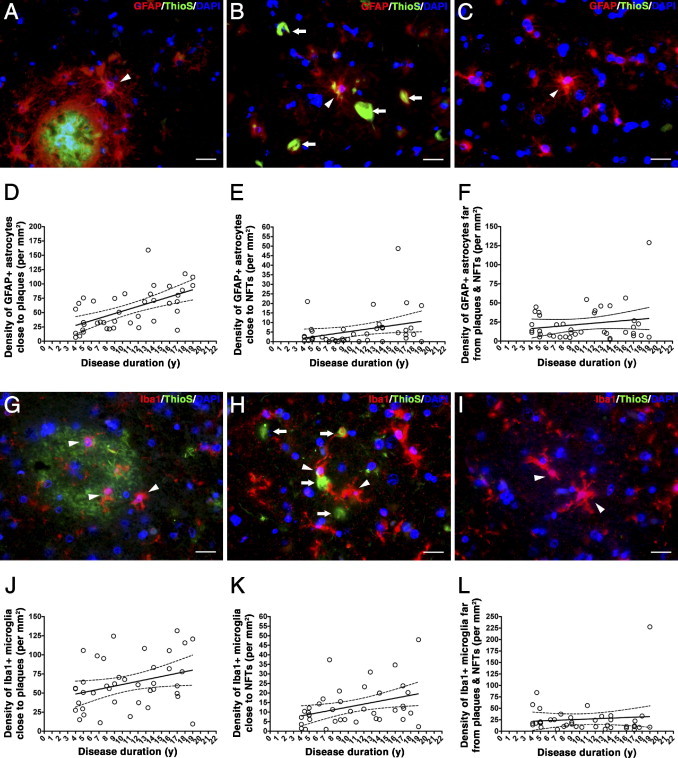
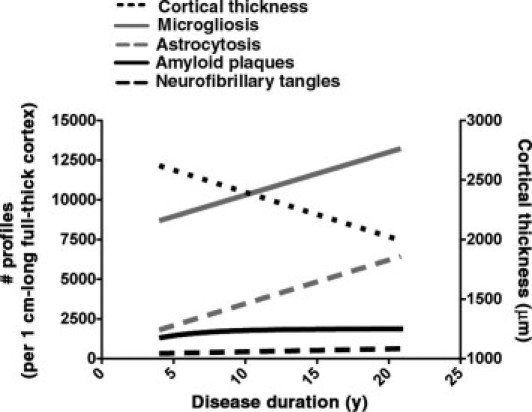
Senile plaques are a prominent pathological feature of Alzheimer's disease (AD), but little is understood about the association of glial cells with plaques or about the dynamics of glial responses through the disease course. We investigated the progression of reactive glial cells and their relationship with AD pathological hallmarks to test whether glial cells are linked only to amyloid deposits or also to tangle deposition, thus integrating both lesions as a marker of disease severity. We conducted a quantitative stereology-based post-mortem study on the temporal neocortex of 15 control subjects without dementia and 91 patients with AD, including measures of amyloid load, neurofibrillary tangles, reactive astrocytes, and activated microglia. We also addressed the progression of glial responses in the vicinity (≤50 μm) of dense-core plaques and tangles. Although the amyloid load reached a plateau early after symptom onset, astrocytosis and microgliosis increased linearly throughout the disease course. Moreover, glial responses correlated positively with tangle burden, whereas astrocytosis correlated negatively with cortical thickness. However, neither correlated with amyloid load. Glial responses increased linearly around existing plaques and in the vicinity of tangles. These results indicate that the progression of astrocytosis and microgliosis diverges from that of amyloid deposition, arguing against a straightforward relationship between glial cells and plaques. They also suggest that reactive glia might contribute to the ongoing neurodegeneration.


Figures

Figure 1
Figure 1
Progression of cortical atrophy and amyloid deposition in the temporal neocortex in AD (see also Table 3). A: Cortical thickness decreased linearly, along with the symptomatic disease duration, indicating that this is a reliable proxy of disease severity. Amyloid burden (B) and total number of plaques (C) increased during the first years of the clinical course of the disease but reached a plateau soon after.
Figure 2
Figure 2
Progression of fibrillar and oligomeric Aβ burden in the temporal neocortex (see also Table 4). A and C: Only the AD subset is shown (open circles, n = 40). B and D: The highly selected subset of controls without dementia and with dense-core plaques is also included, with a disease duration of 0 years (dark gray circles, n = 6). In A and B, a small increase in the number of dense-core plaques was only detectable during the first years after the onset of cognitive symptoms. In C and D, the number of NAB61-positive oligomeric Aβ-enriched plaques remained unchanged after symptom onset.
Figure 3
Figure 3
Progression of glial responses in the temporal neocortex (see also Table 3). A and C: Only the AD cohort is shown (open circles, n = 91). B and D: The controls without dementia and with plaques are also included, with a clinical disease duration of 0 years (dark gray circles, n = 10). Both astrocytosis (A and B) and microgliosis (C and D) significantly increased in a linear fashion, along with disease progression.
Figure 4
Figure 4
Correlations between glial responses and measures of amyloid deposition in AD. Neither astrocytosis nor microgliosis correlated with amyloid burden (A and B) or total number of plaques (C and D).
Figure 5
Figure 5
Correlations between glial responses and markers of neurodegeneration in AD. Astrocytosis (A) and microgliosis (B) correlated positively with the burden of NFTs. Patients with higher astrocytosis tended to have more cortical atrophy (C), but no association was observed between the extent of microgliosis and cortical thickness (D). PHF, paired helical filament.
Figure 6
Figure 6
Spatial relationship of glial responses and dense-core plaques and NFTs. AC: Photomicrographs of triple staining for GFAP (red), thioflavin-S (ThioS; green), and DAPI (blue) in an AD case. GFAP-positive reactive astrocytes (arrowhead) cluster in the vicinity (≤50 μm) of dense-core plaques (A), but they can also be seen in close association to NFTs (B, arrows) and free in the neuropil (C). Scale bar = 20 μm. The density of reactive astrocytes increased linearly in the proximity of dense-core plaques (D) and close to NFTs (E); by contrast, reactive astrocytes did not increase far (>50 μm) from dense-core plaques and NFTs (F). GI: Photomicrographs of triple staining for Iba1 (red), ThioS (green), and DAPI (blue) in an AD case. Iba1-positive activated microglial cells (arrowheads) cluster in the vicinity (≤50 μm) of dense-core plaques (G), but they can also be found near NFTs (H, arrows) and free in the neuropil (I). Scale bar = 20 μm. Microgliosis increased linearly close to both plaques (J) and NFTs (K), but no significant increase in the number of activated microglial cells was observed far (>50 μm) from dense-core plaques and NFTs (L).
Figure 7
Figure 7
A model of the progression of AD-related pathological features in the temporal neocortex based on the present results. The regression lines for each of the pathological measures were plotted within a single graph. For clarity purposes, the regression line for cortical thickness was linked to the y axis with a different scale (right). Amyloid deposition reaches a plateau early after the onset of cognitive symptoms, whereas reactive astrocytes, activated microglial cells, and NFTs keep accumulating as the cortical mantle atrophies through the disease course. Remarkably, the slopes indicate that, within a reference area of 1-cm-long full-thickness temporal neocortex, activated microglia and reactive astrocytes accumulate at a strikingly similar average rate of 270 and 275 cells per year, respectively, which is >10-fold higher than the rate of neurofibrillary degeneration (average, 18 tangles per year). Last, cortical thickness decreased at an average rate of 37 μm/year.

References

    1. Itagaki S., McGeer P.L., Akiyama H., Zhu S., Selkoe D. Relationship of microglia and astrocytes to amyloid deposits of Alzheimer disease. J Neuroimmunol. 1989;24:173–182. - PubMed
    1. Ingelsson M., Fukumoto H., Newell K.L., Growdon J.H., Hedley-Whyte E.T., Frosch M.P., Albert M.S., Hyman B.T., Irizarry M.C. Early Aβ accumulation and progressive synaptic loss, gliosis, and tangle formation in AD brain. Neurology. 2004;62:925–931. - PubMed
    1. McKhann G., Drachman D., Folstein M., Katzman R., Price D., Stadlan E.M. Clinical diagnosis of Alzheimer's disease: report of the NINCDS-ADRDA Work Group under the auspices of the Department of Health and Human Services Task Force on Alzheimer's Disease. Neurology. 1984;34:939–944. - PubMed
    1. The National Institute on Aging, and Reagan Institute Working Group on Diagnostic Criteria for the Neuropathological Assessment of Alzheimer's Disease: Consensus recommendations for the postmortem diagnosis of Alzheimer's disease. Neurobiol Aging. 1997;18(Suppl):S1–S2. - PubMed
    1. Freeman S.H., Kandel R., Cruz L., Rozkalne A., Newell K., Frosch M.P., Hedley-Whyte E.T., Locascio J.J., Lipsitz L.A., Hyman B.T. Preservation of neuronal number despite age-related cortical brain atrophy in elderly subjects without Alzheimer disease. J Neuropathol Exp Neurol. 2008;67:1205–1212. - PMC - PubMed

Publication types