Review
. 2012 Mar;1822(3):317-24.
doi: 10.1016/j.bbadis.2011.07.002. Epub 2011 Jul 14.

Structural imaging in early pre-states of dementia

Affiliations
Review

Structural imaging in early pre-states of dementia

Charles D Smith. Biochim Biophys Acta. 2012 Mar.

Abstract

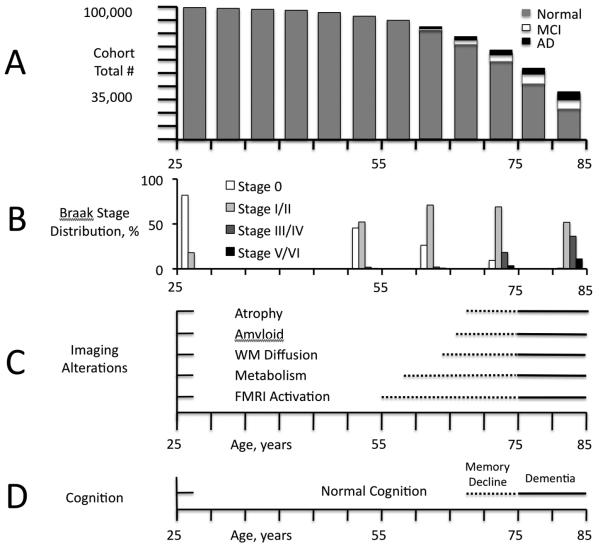
In this review focus is on structural imaging in the Alzheimer's disease (AD) pre-states, particularly cognitively normal (CN) persons at future dementia risk. Findings in mild cognitive impairment (MCI) are described here only for comparison with CN. Cited literature evidence and commentary address issues of structural imaging alterations in CN that precede MCI and AD, regional patterns of such alterations, and the time relationship between structural imaging alterations and the appearance of symptoms of AD, issues relevant to the conduct of future AD prevention trials. This article is part of a Special Issue entitled: Imaging Brain Aging and Neurodegenerative disease.


Figures

Figure 1
Figure 1
Simple Model of the AD Timecourse (Modified from [17]). A. Illustration of a statistical cohort of 100,000 persons beginning at age 25 years, with bar height representing the expected remaining population at each 5-year interval to age 85 based on the US census [88, 89]. Each bar divided into proportionate parts representing the expected number of persons with AD (black) or MCI (white), or who remain normal (grey), based on US population model estimates [89, 90]. The incidence of MCI and AD, and overall death rate accelerate after age 55. B. Percentage of Braak stages over the same age range based on Braak [89, 91, 92]. C. Conceptual diagram of the appearance of different image features by modality and age in a nominal cohort of persons who develop symptoms of AD at age 75 years, based on results in the current literature [17]. Dotted lines represent the variable appearance in individuals of the first detectible image changes within each modality, some of which may precede symptoms by several years. Solid lines represent the more certain appearance of alterations near the time symptoms appear (within a few years). The character and distribution of image alterations may change over time, e.g., in functional MRI activation, a subtlety not captured in this simplified diagram. D. In the nominal cohort, memory decline within the normal range of scores becomes detectible by sensitive tests and longitudinal assessment, later associated with a complaint noticed by patient and outside observers, but without functional decline. Differences in rate of decline within the normal range may be dissected out using imaging and other biomarkers of AD neuropathology. These differences could result in a re-definition of CN.
Figure 2
Figure 2
Voxelwise negative correlation between amyloid burden in normal subjects with elevated global 11C-PIB binding and hippocampal volume (r = −0.6, p = 0.02 using inferior temporal region). This relationship was not seen in subjects with MCI or AD, or in other brain regions outside of the inferomedial temporal lobe and parieto-occipital junction. With permission from [51]. Views: a- sagittal; b- coronal; c- axial.
Figure 3
Figure 3
Brain structural alterations in cognitively normal persons at risk of MCI or AD. A. Volume within a template identified by retrospective classification of baseline scans in CN subjects demonstrating a region of significantly reduced grey matter volume at baseline in those who later developed MCI within 5 years (yellow-white color scale). Views: a,d- sagittal; b- coronal; c- axial. Prediction accuracy of volume within this brain region alone was 76%, and 87% when combined with psychometric data (With permission from [21]). B. Decreasing rates of conversion from CN to AD over the observation period by average baseline cortical thickness, averaged across nine regions of interest, classified as low (1 SD below the entire cohort mean), average (within 1 SD of the mean), and high (1 SD above the mean – the rate was zero in this group). Regions of interest were selected by finding significant differences in cortical thickness between AD and CN in a prior study (inset left, nine color-coded regions projected on partially inflated brain surface image). Retrospective classification of baseline scans in CN subjects allowed calculation of thickness differences between baseline CN who developed AD vs. those who remained CN (With permission from [71]).
Figure 3
Figure 3
Brain structural alterations in cognitively normal persons at risk of MCI or AD. A. Volume within a template identified by retrospective classification of baseline scans in CN subjects demonstrating a region of significantly reduced grey matter volume at baseline in those who later developed MCI within 5 years (yellow-white color scale). Views: a,d- sagittal; b- coronal; c- axial. Prediction accuracy of volume within this brain region alone was 76%, and 87% when combined with psychometric data (With permission from [21]). B. Decreasing rates of conversion from CN to AD over the observation period by average baseline cortical thickness, averaged across nine regions of interest, classified as low (1 SD below the entire cohort mean), average (within 1 SD of the mean), and high (1 SD above the mean – the rate was zero in this group). Regions of interest were selected by finding significant differences in cortical thickness between AD and CN in a prior study (inset left, nine color-coded regions projected on partially inflated brain surface image). Retrospective classification of baseline scans in CN subjects allowed calculation of thickness differences between baseline CN who developed AD vs. those who remained CN (With permission from [71]).

References

    1. Caselli RJ, Dueck AC, Locke DE, Hoffman-Snyder CR, Woodruff BK, Rapcsak SZ, Reiman EM. Longitudinal modeling of frontal cognition in APOE {varepsilon}4 homozygotes, heterozygotes, and noncarriers. Neurology. 2011;76:1383–1388. - PMC - PubMed
    1. Goldman WP, Price JL, Storandt M, Grant EA, McKeel DW, Jr., Rubin EH, Morris JC. Absence of cognitive impairment or decline in preclinical Alzheimer’s disease. Neurology. 2001;56:361–367. - PubMed
    1. Linn RT, Wolf PA, Bachman DL, Knoefel JE, Cobb JL, Belanger AJ, Kaplan EF, D’Agostino RB. The ‘preclinical phase’ of probable Alzheimer’s disease. A 13-year prospective study of the Framingham cohort. Arch Neurol. 1995;52:485–490. - PubMed
    1. Fjell AM, Walhovd KB. Structural brain changes in aging: courses, causes and cognitive consequences. Rev Neurosci. 2010;21:187–221. - PubMed
    1. Salthouse TA. Selective review of cognitive aging. J Int Neuropsychol Soc. 2010;16:754–760. - PMC - PubMed

Publication types

MeSH terms