Comparative Study
. 2011 Sep 2;109(6):629-38.
doi: 10.1161/CIRCRESAHA.111.243410. Epub 2011 Jul 21.

β-myosin heavy chain is induced by pressure overload in a minor subpopulation of smaller mouse cardiac myocytes

Affiliations
Comparative Study

β-myosin heavy chain is induced by pressure overload in a minor subpopulation of smaller mouse cardiac myocytes

Javier E López et al. Circ Res. .

Abstract

Rationale: Induction of the fetal hypertrophic marker gene β-myosin heavy chain (β-MyHC) is a signature feature of pressure overload hypertrophy in rodents. β-MyHC is assumed present in all or most enlarged myocytes.

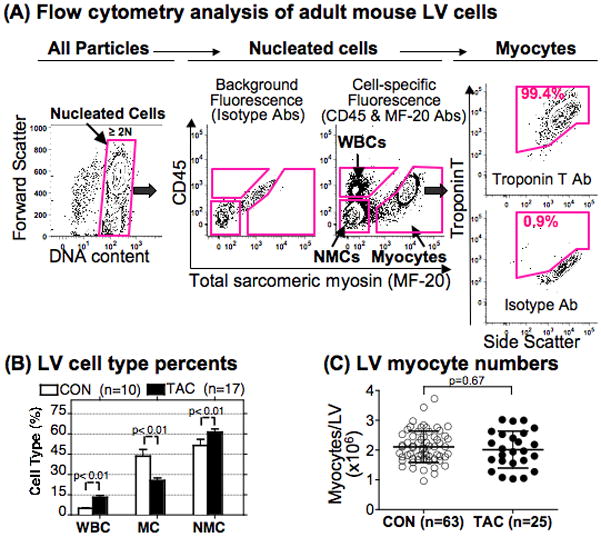
Objective: To quantify the number and size of myocytes expressing endogenous β-MyHC by a flow cytometry approach.

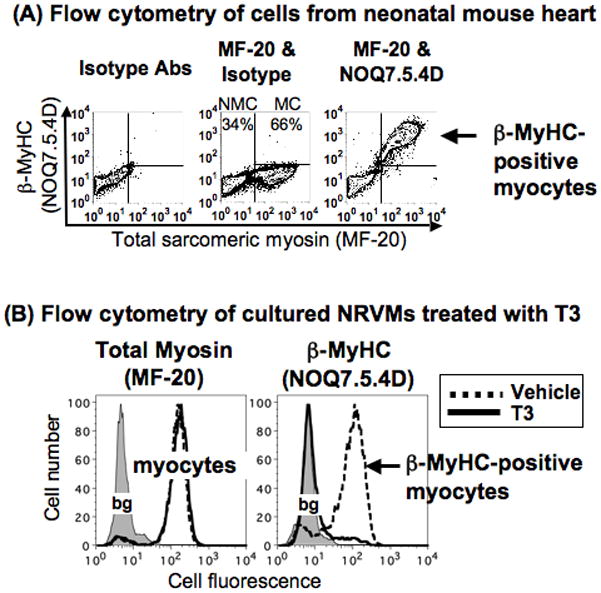
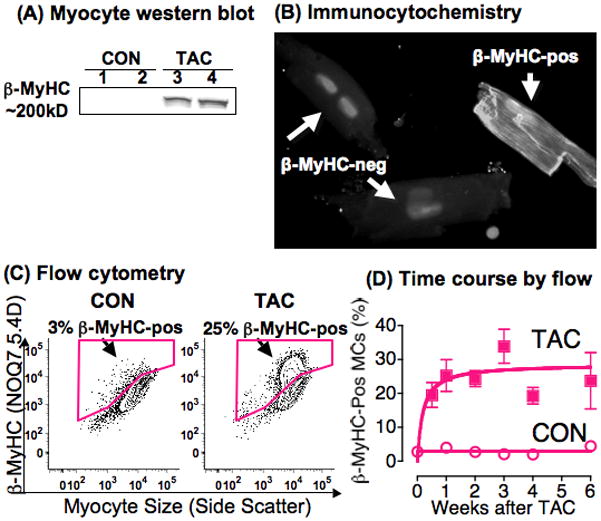
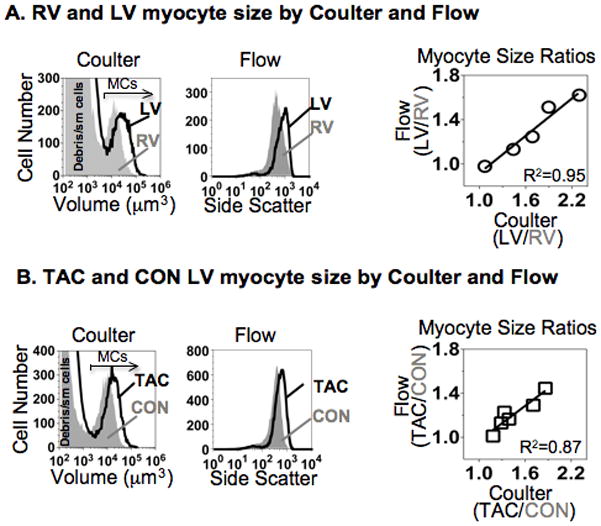
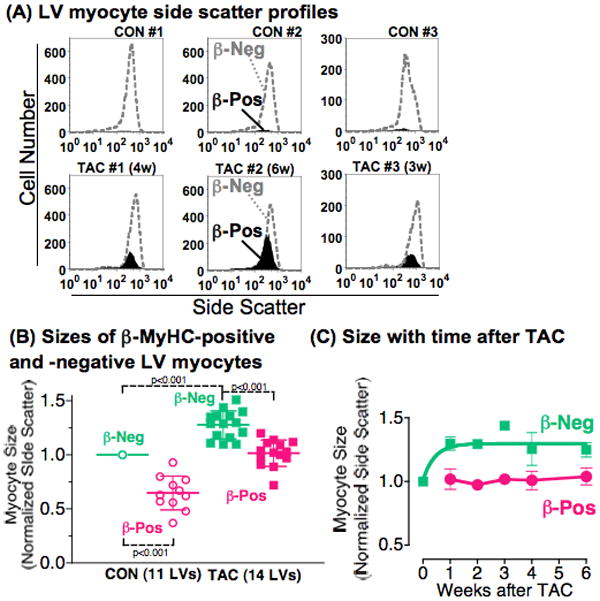
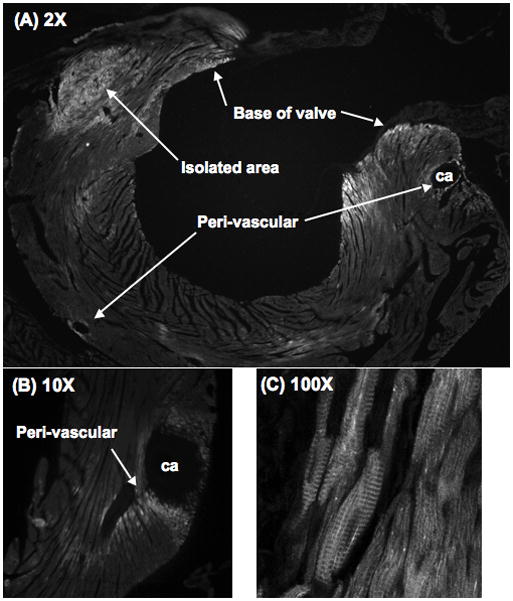
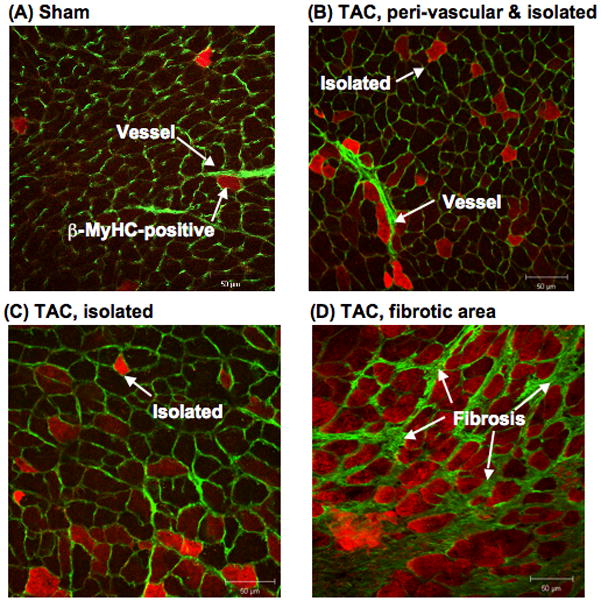
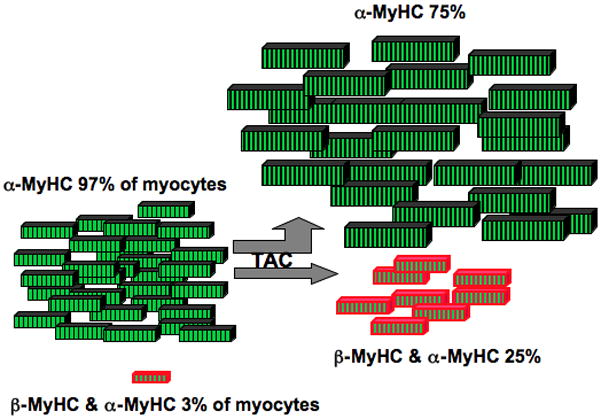
Methods and results: Myocytes were isolated from the left ventricle of male C57BL/6J mice after transverse aortic constriction (TAC), and the fraction of cells expressing endogenous β-MyHC was quantified by flow cytometry on 10,000 to 20,000 myocytes with use of a validated β-MyHC antibody. Side scatter by flow cytometry in the same cells was validated as an index of myocyte size. β-MyHC-positive myocytes constituted 3 ± 1% of myocytes in control hearts (n=12), increasing to 25 ± 10% at 3 days to 6 weeks after TAC (n=24, P<0.01). β-MyHC-positive myocytes did not enlarge with TAC and were smaller at all times than myocytes without β-MyHC (≈70% as large, P<0.001). β-MyHC-positive myocytes arose by addition of β-MyHC to α-MyHC and had more total MyHC after TAC than did the hypertrophied myocytes that had α-MyHC only. Myocytes positive for β-MyHC were found in discrete regions of the left ventricle in 3 patterns: perivascular, in areas with fibrosis, and in apparently normal myocardium.

Conclusions: β-MyHC protein is induced by pressure overload in a minor subpopulation of smaller cardiac myocytes. The hypertrophied myocytes after TAC have α-MyHC only. These data challenge the current paradigm of the fetal hypertrophic gene program and identify a new subpopulation of smaller working ventricular myocytes with more myosin.


Figures

Figure 1
Figure 1. Flow cytometry of single cells from adult mouse LV
(A) Cells isolated from an adult mouse LV were fixed, stained, and analyzed by flow cytometry. Left panel, cells were first gated for DNA content to eliminate debris and identify nucleated cells (boxed area). Middle panel, left side, fluorescence of isotype Abs in the same cell population defined background. Middle panel, right side, cells were identified as WBCs by CD45, as myocytes by MF-20, or as NMCs negative for both proteins. Note that CD45-positive cells do not shift on the X axis, indicating absence of nonspecific binding of anti-myosin Ab. Right panel, myocytes positive for myosin by MF-20 were also positive for troponin T. The 10% contour plots include at least 10,000–20,000 nucleated myocytes, and outliers (small dots) represent <~2% of the cell population. Side scatter (right panel) is an index of cell size. Cell gates (pink) were set to include <1% positive cells when cells from the same LV were stained with isotype Ab. (B) The fraction of different cell types in the LV was measured 1–3w after TAC or Sham control (CON). MC=myocyte, values are mean ± SD, p by 1-way ANOVA and Bonferroni’s post-test. (C) Myocytes isolated from TAC and CON hearts were counted in a hemocytometer. Values are mean ± SD, p by Student-t test.
Figure 2
Figure 2. Validation of β-MyHC antibody
(A) Cells isolated from the neonatal mouse heart were stained with MF-20, NOQ7.5.4D, or isotype Ab controls, and analyzed by bivariate flow cytometry. Left panel, background defined by isotype Abs. Middle panel, MF-20 defines myocytes (MCs) (66% of cells) and NMCs (34% of cells). Right panel, almost all myocytes stain for β-MyHC with NOQ7.5.4D. At least 10,000–20,000 nucleated cells were analyzed for each heart, and 6 hearts from the same litter had similar results. (B) Cultured NRVMs in serum-free medium were treated 3d with vehicle (dashed lines) or T3 (100nM, solid lines), removed from the dish, fixed, and stained for flow cytometry with (left panel) MF-20 for total sarcomeric myosin, or with (right panel) NOQ7.5.4D for β-MyHC. T3 eliminates cells with β-MyHC. Background fluorescence (bg, shaded area) was defined by isotype Abs, and each plot is from at least 10,000–20,000 nucleated cells, in n=2 cultures with the same result, run in duplicate.
Figure 3
Figure 3. TAC induces β-MyHC in 25% of adult mouse LV myocytes
(A) Western blot for β-MyHC with NOQ7.5.4D in 400 isolated myocytes per lane from 2 Sham CON and 2 TAC LVs at 3w. (B) Immunocytochemistry with NOQ7.5.4D in three isolated LV myocytes 3w after TAC; nuclei were stained with PI (original 40X). (C) Flow cytometry of 10,000–20,000 myocytes positive for MF-20 from CON and TAC LVs at 3w, plotted as side scatter, a size index (X axis), versus staining for the β-MyHC mAb NOQ7.5.4D (Y axis). Percent β-MyHC-positive is the fraction positive for NOQ7.5.4D divided by the total MF-20-positive myocytes analyzed. Plots are 10% contours, with dots for outlier myocytes. Positive gates for NOQ7.5.4D were set by isotype staining of myocytes from the same heart (not shown), to include <1% positive cells above the isotype-stained population, and the same gate was then applied to the sample stained for β-MyHC, as illustrated in Figure 1A, right panel. (D) The % β-MyHC-positive LV myocytes (MCs) was measured, as in panel C, at 3d to 6w after TAC, and in concurrent Sham CON. N=24 TAC, 12 Sham, p<0.01 for all CON vs. TAC by 1-way ANOVA and Bonferroni’s post-test; p=0.24 among times after TAC.
Figure 4
Figure 4. Validation of flow cytometry side scatter for myocyte size
(A) Left panels, myocytes from LV (black line) and RV free wall (grey shade) of the same mouse heart were analyzed concurrently by Coulter Multisizer for cell volume, and by Flow Cytometry for side scatter. Arrow in Coulter panel shows the gate used to identify large myocytes (MCs; 10,000–20,000per ventricle). Flow panel depicts only the nucleated myocytes (MF-20-positive, 10,000–20,000 per ventricle), to eliminate debris and small (sm) nonmyocytes from size analysis. Note that a right-shift of the profiles indicates larger cell size. Right panel plots myocyte size ratios (LV/RV) determined by Flow mean side scatter vs. Coulter mean cell volume for myocytes from 5 adult mouse hearts. R2 by linear regression, p<0.01. (B) Left panels, LV myocytes from a pair of TAC (black line) and CON (grey shade) hearts were analyzed concurrently both by Coulter cell volume and Flow side scatter, exactly as in A. Right panel plots myocyte size ratios (TAC/CON) determined by Flow vs. Coulter for 6 pairs of hearts. R2 by linear regression, p<0.01.
Figure 5
Figure 5. β-MyHC-positive myocytes are smaller
(A) LV myocytes (10,000–20,000) from 3 CON LVs (#1–3) and 3 TAC LVs at 3–6w (#1–3) were stained with MF-20 and the β-MyHC mAb NOQ7.5.4D, and side scatter profiles were determined by flow cytometry. β-MyHC-positive myocytes are solid black fill, β-MyHC-negative myocytes are grey dotted line. Note the left-shift to smaller sizes of β-MyHC-positive cells. (B) Mean side scatter of β-MyHC-positive and -negative myocytes from the same LV was quantified as in panel A, for 11 CON and 14 mice at 1–6w after TAC. Pairs of TAC and CON LVs were assayed on the same cytometer on the same day, and side scatter of each sub-population was normalized to the mean side scatter of CON β-MyHC-negative myocytes, arbitrarily set at 1. In 1 assay, 3 TAC LVs were normalized to 1 CON LV. Each point is 1 LV. Lines indicate mean ± SD, p by 1-way ANOVA and Bonferroni’s post-test. (C) Myocyte size was plotted versus time after TAC. Values are mean±SE; the number of LVs is 5, 2, 1, 3, and 3 at weeks 1, 2, 3, 4, and 6.
Figure 6
Figure 6. β-MyHC positive myocytes by immunohistochemistry are in discreet areas of the LV after TAC
Fixed frozen sections 3w after TAC were stained with the β-MyHC mAb NOQ7.5.4D conjugated to Zenon-488 (green). (A) Low magnification shows discrete regions with β-MyHC-positive myocytes (bright), including peri-vascular (coronary artery, ca), the base of the mitral valve, and an isolated positive region. (B) Detail of a peri-vascular area. (C) High magnification confirms that positive myocytes have cross striations, indicating sarcomere staining.
Figure 7
Figure 7. β-MyHC-positive LV myocytes after TAC in relation to vessels and fibrosis
Fixed frozen sections 3w after TAC or Sham surgery were stained with the mAb NOQ7.5.4D conjugated to Zenon-546 to label β-MyHC-positive myocytes (orange), plus wheat germ agglutinin to label membranes, vessels, and fibrosis (green). (A) In Sham, peri-vascular and isolated areas have a few β-MyHC-positive myocytes. After TAC, β-MyHC-positive myocytes are found (B) peri-vascular and in an isolated area away from a vessel or fibrosis; (C) in an isolated area away from vessels or fibrosis; and (D) clustered in an area of fibrosis.
Figure 8
Figure 8. β-MyHC is in a small sub-population of small myocytes
The rectangles represent myocytes, and are shown in the relative number and volume measured in this study. In control C57Bl/6J male mouse hearts, 97% of myocytes had α-MyHC protein only (green), and 3% of myocytes co-expressed both β-MyHC (red) and α-MyHC proteins. After TAC, 25% of myocytes were positive for both β-MyHC and α-MyHC, suggesting that the β-MyHC cells arose by new synthesis of β-MyHC in α-MyHC-containing myocytes. Myocytes with β-MyHC were significantly smaller than the myocytes with α-MyHC only, before TAC and after TAC. The hypertrophied myocytes after TAC expressed only α-MyHC, and the amount of α-MyHC per myocyte did not appear to increase as much as did cell size. β-MyHC cells had significantly more total MyHC.

References

    1. Lompre AM, Schwartz K, d’Albis A, Lacombe G, Van Thiem N, Swynghedauw B. Myosin isoenzyme redistribution in chronic heart overload. Nature. 1979;282:105–107. - PubMed
    1. Lompre AM, Nadal-Ginard B, Mahdavi V. Expression of the cardiac ventricular alpha- and beta-myosin heavy chain genes is developmentally and hormonally regulated. J Biol Chem. 1984;259:6437–6446. - PubMed
    1. Izumo S, Lompre AM, Matsuoka R, Koren G, Schwartz K, Nadal-Ginard B, Mahdavi V. Myosin heavy chain messenger RNA and protein isoform transitions during cardiac hypertrophy. Interaction between hemodynamic and thyroid hormone-induced signals. J Clin Invest. 1987;79:970–977. - PMC - PubMed
    1. Waspe LE, Ordahl CP, Simpson PC. The cardiac beta-myosin heavy chain isogene is induced selectively in alpha 1-adrenergic receptor-stimulated hypertrophy of cultured rat heart myocytes. J Clin Invest. 1990;85:1206–1214. - PMC - PubMed
    1. Mercadier JJ, Lompre AM, Wisnewsky C, Samuel JL, Bercovici J, Swynghedauw B, Schwartz K. Myosin isoenzyme changes in several models of rat cardiac hypertrophy. Circ Res. 1981;49:525–532. - PubMed

Publication types

MeSH terms