

Neighborhood socioeconomic disadvantage and the shape of the age-crime curve
- PMID: 21778512
- PMCID: PMC3222502
- DOI: 10.2105/AJPH.2010.300034
Neighborhood socioeconomic disadvantage and the shape of the age-crime curve
Abstract
Objectives: We sought to better determine the way in which neighborhood disadvantage affects the shape of the age-crime curve.
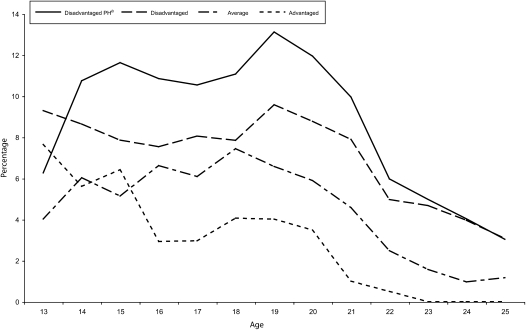
Methods: We used data from the Pittsburgh Youth Study (PYS), a 14-year longitudinal study, to compare the age-crime curves of individuals in neighborhoods of different disadvantage. We visually compared observed age-crime curves, and then used generalized linear mixed models to test for differences in curve parameters.
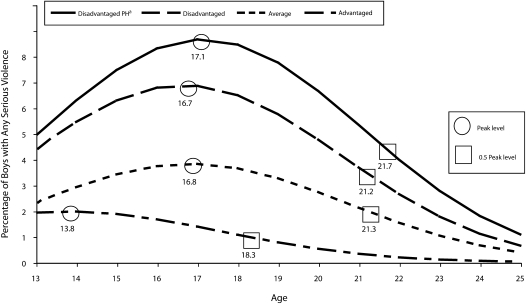
Results: Adjusted for individual risk factors, the mixed models found that the parameters for interactions of neighborhood disadvantage with both linear age and quadratic age were significant (P < .05) and consistent with higher and longer age-crime curves in more disadvantaged neighborhoods. This implied that compared with boys in advantaged neighborhoods, rates of violence among boys in disadvantaged neighborhoods rose to higher levels that were sustained significantly longer.
Conclusions: These results suggested that residing in a disadvantaged neighborhood during early adolescence may have an enduring effect on the shape of the age-crime curve throughout an individual's life.
Figures
References
-
- Farrington DP. Age and crime. : Tonry M, Morris N, Crime and Justice: An Annual Review of Research. Chicago, IL: University of Chicago Press; 1986:189–250
-
- Steffensmeier DJ, Allan AE, Harer MD, Streifel C. Age and distribution of crime. Am J Sociol. 1989;94:803–831
-
- Piquero AR, Farrington DP, Blumstein A. The criminal career paradigm: background and recent developments. Crime and Justice: A Review of Research 2003;30:359–506
-
- Piquero AR. Taking stock of developmental trajectories of criminal activity over the life course. : Liberman A, The Long View of Crime: A Synthesis of Longitudinal Research. New York: Springer; 2008:23–78
-
- Nagin D, Tremblay RE. Trajectories of boys’ physical aggression, opposition, and hyperactivity on the path to physically violent and nonviolent juvenile delinquency. Child Dev. 1999;70(5):1181–1196 - PubMed
Publication types
MeSH terms
Grants and funding
LinkOut - more resources
Full Text Sources
