

Four-year weight losses in the Look AHEAD study: factors associated with long-term success
- PMID: 21779086
- PMCID: PMC3183129
- DOI: 10.1038/oby.2011.230
Four-year weight losses in the Look AHEAD study: factors associated with long-term success
Abstract
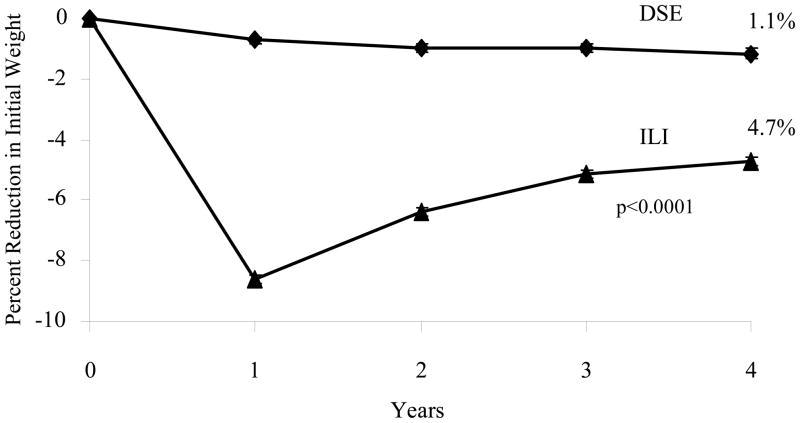
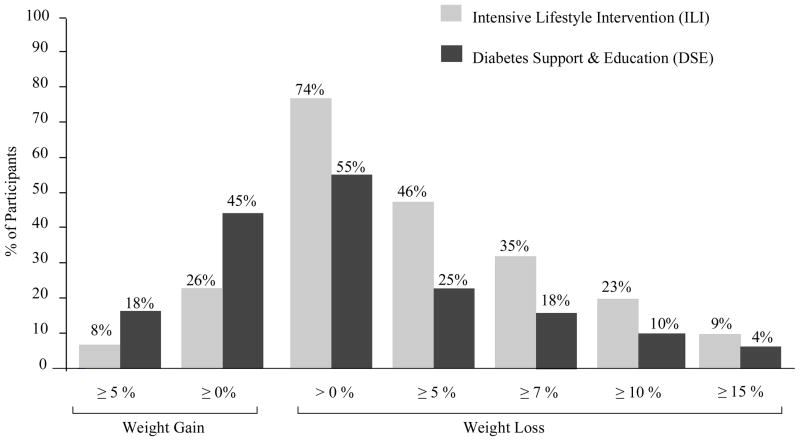
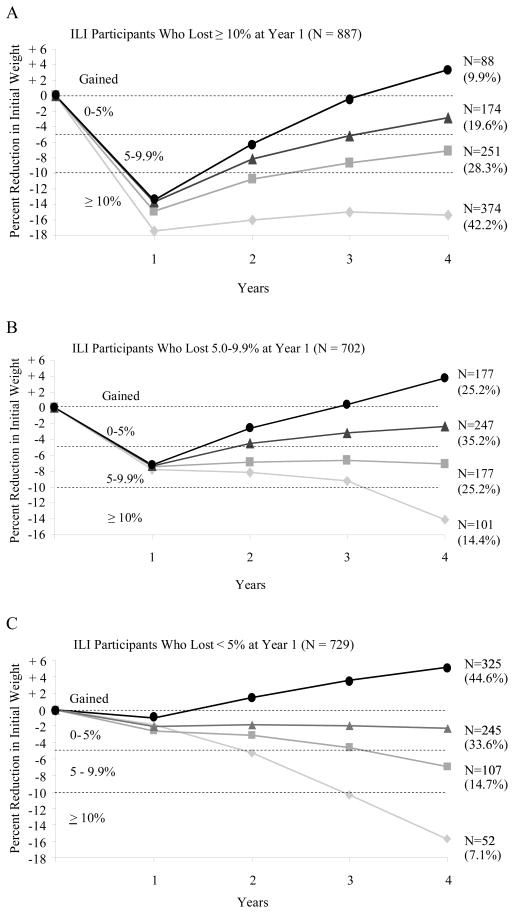
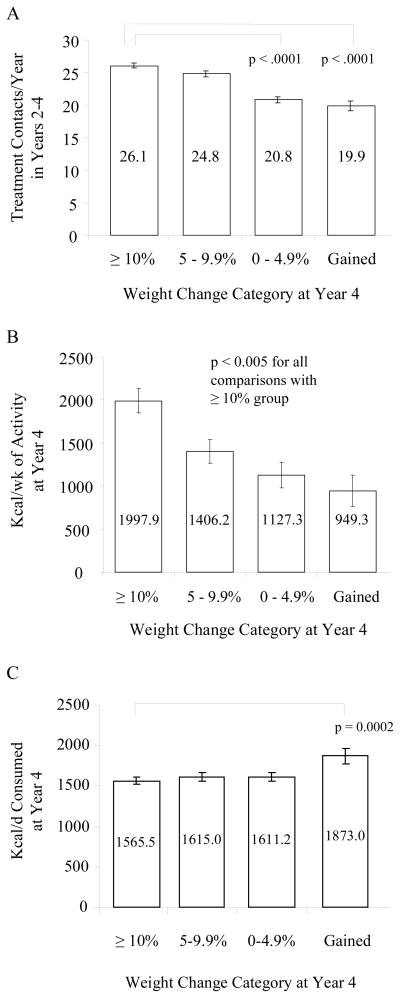
This report provides a further analysis of the year 4 weight losses in the Look AHEAD (Action for Health in Diabetes) study and identifies factors associated with long-term success. A total of 5,145 overweight/obese men and women with type 2 diabetes were randomly assigned to an intensive lifestyle intervention (ILI) or a usual care group, referred to as Diabetes Support and Education (DSE). ILI participants were provided approximately weekly group or individual treatment in year 1; continued but less frequent contact was provided in years 2-4. DSE participants received three group educational sessions in all years. As reported previously, at year 4, ILI participants lost an average of 4.7% of initial weight, compared with 1.1% for DSE (P < 0.0001). More ILI than DSE participants lost ≥ 5% (46% vs. 25%, P < 0.0001) and ≥ 10% (23% vs. 10%, P < 0.0001) of initial weight. Within the ILI, achievement of both the 5% and 10% categorical weight losses at year 4 was strongly related to meeting these goals at year 1. A total of 887 participants in ILI lost ≥ 10% at year 1, of whom 374 (42.2%) achieved this loss at year 4. Participants who maintained the loss, compared with those who did not, attended more treatment sessions and reported more favorable physical activity and food intake at year 4. These results provide critical evidence that a comprehensive lifestyle intervention can induce clinically significant weight loss (i.e., ≥ 5%) in overweight/obese participants with type 2 diabetes and maintain this loss in more than 45% of patients at 4 years.
Figures
References
-
- Ryan DH, Espeland MA, Foster GD, et al. Look AHEAD (Action for Health in Diabetes): design and methods for a clinical trial of weight loss for the prevention of cardiovascular disease in type 2 diabetes. Control Clin Trials. 2003;24:610–28. - PubMed
-
- Wing RR. Behavioral approaches to treatment. In: Bray GA, Bouchard C, editors. Handbook of Obesity: Clinical Applications. 2. Marcel Dekker, Inc; New York: 2004. pp. 147–167.
-
- Wadden TA, Butryn ML, Wilson C. Lifestyle modification for the management of obesity. Gastroenterology. 2007;132:2226–38. - PubMed
-
- Wadden TA, Sternberg JA, Letizia KA, Stunkard AJ, Foster GD. Treatment of obesity by very low calorie diet, behavior therapy, and their combination: a five-year perspective. Int J Obes. 1989;13 (Suppl 2):39–46. - PubMed
Publication types
MeSH terms
Grants and funding
- DK57078/DK/NIDDK NIH HHS/United States
- U01 DK057151/DK/NIDDK NIH HHS/United States
- DK57151/DK/NIDDK NIH HHS/United States
- U01 DK057154/DK/NIDDK NIH HHS/United States
- U01 DK057171/DK/NIDDK NIH HHS/United States
- U01 DK057182/DK/NIDDK NIH HHS/United States
- U01 DK057136/DK/NIDDK NIH HHS/United States
- U01 DK057002/DK/NIDDK NIH HHS/United States
- U01 DK057177/DK/NIDDK NIH HHS/United States
- M01 RR001066/RR/NCRR NIH HHS/United States
- U01 DK057078/DK/NIDDK NIH HHS/United States
- DK57008/DK/NIDDK NIH HHS/United States
- M01RR000056/RR/NCRR NIH HHS/United States
- DK57135/DK/NIDDK NIH HHS/United States
- UL1 RR 024153/RR/NCRR NIH HHS/United States
- P30 DK048520/DK/NIDDK NIH HHS/United States
- U01 DK057135/DK/NIDDK NIH HHS/United States
- UL1 RR024153/RR/NCRR NIH HHS/United States
- P30 DK046204/DK/NIDDK NIH HHS/United States
- DK57171/DK/NIDDK NIH HHS/United States
- M01 RR002719/RR/NCRR NIH HHS/United States
- DK57131/DK/NIDDK NIH HHS/United States
- M01 RR000056/RR/NCRR NIH HHS/United States
- U01 DK057219/DK/NIDDK NIH HHS/United States
- DK57149/DK/NIDDK NIH HHS/United States
- U01 DK056992/DK/NIDDK NIH HHS/United States
- M01RR01066/RR/NCRR NIH HHS/United States
- DK57182/DK/NIDDK NIH HHS/United States
- DK57002/DK/NIDDK NIH HHS/United States
- M01RR01346/RR/NCRR NIH HHS/United States
- DK57178/DK/NIDDK NIH HHS/United States
- P30 DK48520/DK/NIDDK NIH HHS/United States
- U01 DK057131/DK/NIDDK NIH HHS/United States
- M01 RR000051/RR/NCRR NIH HHS/United States
- ImNIH/Intramural NIH HHS/United States
- DK57136/DK/NIDDK NIH HHS/United States
- DK57154/DK/NIDDK NIH HHS/United States
- DK57219/DK/NIDDK NIH HHS/United States
- DK57177/DK/NIDDK NIH HHS/United States
- U01 DK056990/DK/NIDDK NIH HHS/United States
- U01 DK057178/DK/NIDDK NIH HHS/United States
- U01 DK057008/DK/NIDDK NIH HHS/United States
- DK56990/DK/NIDDK NIH HHS/United States
- M01RR0021140/RR/NCRR NIH HHS/United States
- DK 046204/DK/NIDDK NIH HHS/United States
- U01 DK057149/DK/NIDDK NIH HHS/United States
- M01RR02719/RR/NCRR NIH HHS/United States
- M01 RR001346/RR/NCRR NIH HHS/United States
- DK56992/DK/NIDDK NIH HHS/United States
- P30 DK017047/DK/NIDDK NIH HHS/United States
- M01RR00051/RR/NCRR NIH HHS/United States
LinkOut - more resources
Full Text Sources
Medical
Research Materials
