. 2011 Jul;7(7):e1002124.
doi: 10.1371/journal.ppat.1002124. Epub 2011 Jul 14.

Divergent effects of human cytomegalovirus and herpes simplex virus-1 on cellular metabolism

Affiliations

Divergent effects of human cytomegalovirus and herpes simplex virus-1 on cellular metabolism

Livia Vastag et al. PLoS Pathog. 2011 Jul.

Abstract

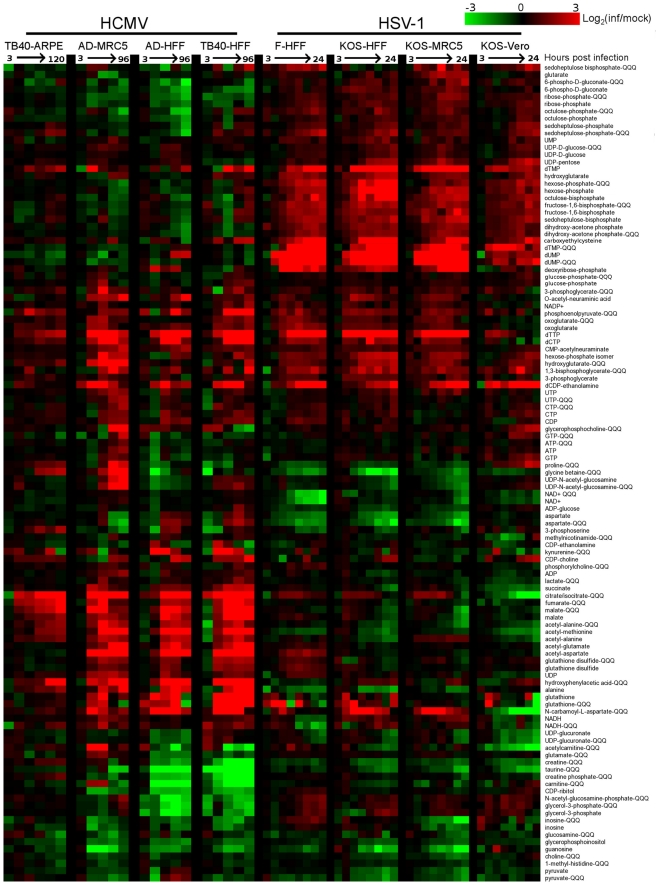
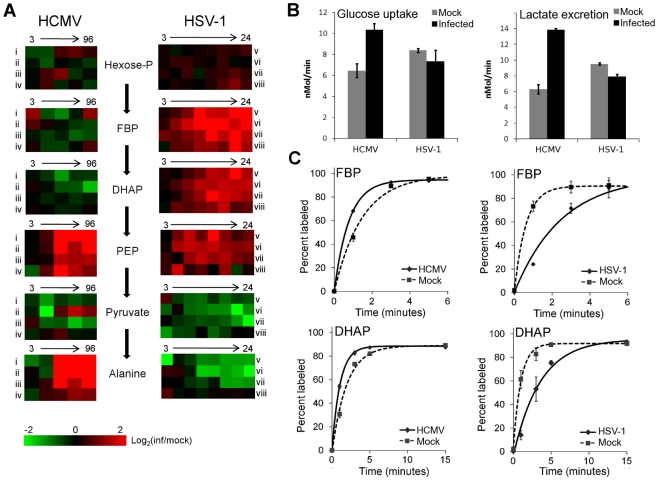
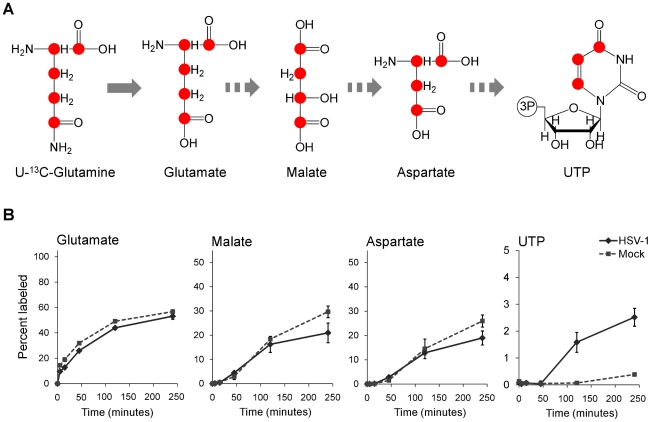
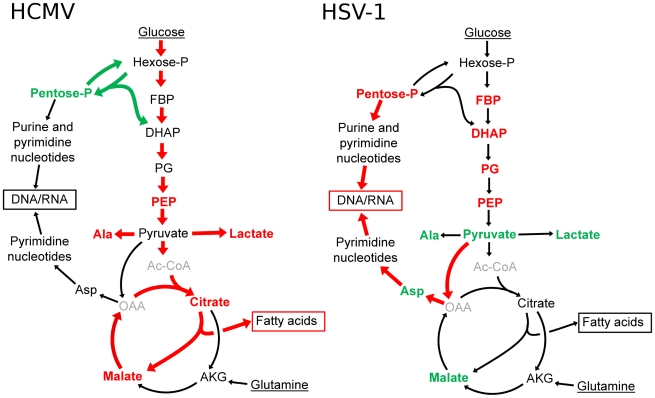
Viruses rely on the metabolic network of the host cell to provide energy and macromolecular precursors to fuel viral replication. Here we used mass spectrometry to examine the impact of two related herpesviruses, human cytomegalovirus (HCMV) and herpes simplex virus type-1 (HSV-1), on the metabolism of fibroblast and epithelial host cells. Each virus triggered strong metabolic changes that were conserved across different host cell types. The metabolic effects of the two viruses were, however, largely distinct. HCMV but not HSV-1 increased glycolytic flux. HCMV profoundly increased TCA compound levels and flow of two carbon units required for TCA cycle turning and fatty acid synthesis. HSV-1 increased anapleurotic influx to the TCA cycle through pyruvate carboxylase, feeding pyrimidine biosynthesis. Thus, these two related herpesviruses drive diverse host cells to execute distinct, virus-specific metabolic programs. Current drugs target nucleotide metabolism for treatment of both viruses. Although our results confirm that this is a robust target for HSV-1, therapeutic interventions at other points in metabolism might prove more effective for treatment of HCMV.


Conflict of interest statement

The authors have declared that no competing interests exist.

Figures

Figure 1
Figure 1. Divergent metabolic profiles of HCMV- and HSV-1-infected cells.
Metabolite levels during the course of HCMV and HSV-1 infection, normalized by packed cell volume and expressed relative to levels measured in the equivalent mock-treated host cells. Ratios are log transformed and plotted on a color scale. Rows correspond to metabolites measured either by LC-high resolution MS or LC-triple quadrupole MS/MS (those measured by triple quadruople are marked “QQQ”). Columns correspond to hours post infection for each of the eight infection time courses. The host cells and virus strains used in each time course are indicated. HCMV (strains TB40/E and AD169) and HSV-1 (strains KOS and F) were used to infect growing epithelial (ARPE19 and Vero) and growth arrested fibroblasts (HFF and MRC5). During HCMV infection samples were taken at 3, 24, 48, 72, 96 hpi, and also at 120 hpi during the infection of ARPE19 cells with the TB40/E strain. During HSV infection samples were collected at 3, 6, 9, 12, 15, 18, 21, and 24 hpi. Values are averages of duplicate independent biological experiments. To view the same figure in blue-yellow color scale, see Figure S1.
Figure 2
Figure 2. Perturbation of glycolysis by HCMV and HSV-1.
(A) Plots of individual metabolite abundance during HCMV and HSV-1 infection. Data are the same as presented in Figure 1. Metabolite concentrations are expressed relative to equivalent mock-treated cells. Rows correspond to infection time courses of the following virus strains and cell types: (i) TB40-HFF, (ii) AD169-HFF, (iii) AD169-MRC5, (iv) TB40-ARPE19, (v) F-HFF, (vi) KOS-HFF, (vii) KOS-MRC5, (viii) KOS-Vero. Columns correspond to time points: 3, 24, 48, 72, 96 hpi for HCMV and 3, 6, 9, 12, 15, 18, 21, 24 hpi for HSV-1 (Hexose-P: glucose-6-phosphate and its isomers; FBP: fructose-1,6-bisphosphate; DHAP: dihydroxy acetone-phosphate; PEP: phosphoenolpyruvate). (B) Measurement of glucose uptake and lactate excretion rates in HCMV-AD169 or HSV-KOS infected, as well as mock-treated, human foreskin fibroblasts (mean ±2 s.e.; n = 3). (C) Buildup of the labeled fraction of the FBP and DHAP pools after switching cells to uniformly 13C-labeled glucose medium at 12 hpi during HSV-KOS or 48 hpi during HCMV-AD169 infection or equivalent virus-free treatment of HFF cells. Symbols indicate experimental data points ±2 s.e.; n = 2; lines indicate exponential fit.
Figure 3
Figure 3. Virus-specific up-regulation of glucose influx to the TCA cycle.
The left column of schematic show carbon labeling from glucose to the TCA cycle via pyruvate carboxylase and pyruvate dehydrogenase. Red dots denote 13C atoms originating from uniformly 13C-labeled glucose. (A) Labeling patterns when neither pyruvate carboxylase nor pyruvate dehydrogenase are active. (B) Labeling pattern when carbon influx to the TCA cycle from glucose is via pyruvate dehydrogenase. (C) Labeling pattern when carbon influx to the TCA cycle from glucose happens via pyruvate carboxylase. (D) Levels of various labeled forms of citrate expressed as percent of the total citrate pool upon switching HCMV-AD169, HSV-KOS or mock-treated HFF cells to uniformly 13C-labeled glucose medium. HCMV infected cells were switched at 48 hpi, HSV-1-infected cells at 12 hpi. The x-axis indicates time after switching to labeled medium (mean ±1 s.d.; n = 2).
Figure 4
Figure 4. TCA cycle metabolite levels increase in HCMV and drop in HSV-1 infected cells.
Plots of individual metabolite abundance during (A) HCMV and (B) HSV-1 infection. These data are the same as presented in Figure 1. Metabolite concentrations are expressed relative to equivalent mock-treated cells. Rows correspond to infection time courses of the following virus strains and cell types: (i) TB40-HFF, (ii) AD169-HFF, (iii) AD169-MRC5, (iv) TB40-ARPE19, (v) F-HFF, (vi) KOS-HFF, (vii) KOS-MRC5, (viii) KOS-Vero. Columns correspond to time points: 3, 24, 48, 72, 96 hpi for HCMV and 3, 6, 9, 12, 15, 18, 21, 24 hpi for HSV-1.
Figure 5
Figure 5. Upregulation of pyrimidine nucleotide biosynthesis during HSV-1 infection.
Individual metabolite abundance in HSV-1-infected and mock-treated quiescent HFFs. To show separately the trend in mock versus infected cells, metabolite concentrations are expressed relative to the average level measured in mock-infected cells at 3 h post mock treatment (mean ±2 s.e.; n = 2).
Figure 6
Figure 6. Flux to pyrimidine nucleotide synthesis induced by HSV-1 infection.
(A) Schematic of carbon labeling from glutamine to UTP arising during carbon influx from glutamine to the TCA cycle. Red dots denote 13C atoms originating from uniformly 13C-labeled glutamine. (B) Plots show the levels of the labeled form of the indicated metabolites expressed as percent of the total metabolite pool. The labeling arose upon switching HSV-KOS infected or mock treated HFF cells to uniformly 13C-labeled glutamine media. HCMV infected cells were switched at 48 hpi, HSV-1-infected cells at 12 hpi. The x-axis indicates time post media switch (mean ±2 s.e.; n = 2).
Figure 7
Figure 7. HSV-1 replication is inhibited by reducing flux from glucose toward pyrimidine nucleotide synthesis.
(A) Schematic diagram of glucose flux to pyrimidine nucleotide biosynthesis. Red lines mark siRNA-targeted reactions catalyzed by pyruvate carboxylase (PC) and aspartate transaminase 2 (GOT2). (OAA: oxaloacetate, AKG: oxoglutarate, Gln: glutamine). (B) RNA interference knockdown of pyruvate carboxylase (marked by arrow) in MRC5 cells. Cells were transfected with non-targeting siRNAs (NT) or siRNAs targeting pyruvate carboxylase (PC) and harvested at indicated time points after transfection. Pyruvate carboxylase levels in the cells were detected by western blot using specific antibodies. Beta-actin was employed as a loading control. (C) Buildup of 13C3-labeled malate after switching MRC5 cells to uniformly 13C-labeled glucose medium for 2 hours at 10 hpi of HSV-1 (F) infection. The cells have been transfected with a universal non-targeting siRNA (NT) or an siRNA targeting pyruvate carboxylase (PC) 120 h prior to infection (significance: p = 0.007). Symbols indicate experimental data points ±1 s.d.; n = 3; values are given in arbitrary units. (D) Production of infectious HSV-1 (F) and HCMV (AD169) virions in cells transfected with siRNAs against pyruvate carboxylase (PC), aspartate transaminase 2 (GOT2), or a universal negative control (NT). The transfection and infection of MRC5 cells were performed as described in Materials and Methods. Values are expressed relative to non-targeting control (±1 s.d.; n = 3). Conditions resulting in significantly altered virus production (p≤0.05) compared to treatment with the universal negative control are marked with a star.
Figure 8
Figure 8. Divergent effects of HCMV and HSV-1 on central carbon metabolism.
Schematic summary of major metabolite concentration and flux changes in response to HCMV (left panel) and HSV-1 (right panel) infection of growth arrested fibroblasts. Arrow colors denote flux changes and font colors denote metabolite level changes relative to the mock-treated control (red-increased, green-decreased, grey-not detected). (Hexose-P: glucose-6-phosphate and its isomers, Pentose-P: ribose-phosphate and its isomers, FBP: fructose-1,6-bisphosphate, DHAP: dihydroxy acetone-phosphate, PEP: phosphoenolpyruvate, Asp: aspartate, Ala: alanine, Gln: glutamine, AKG: oxoglutarate, OAA: oxaloacetate, Ac-CoA: acetyl-coenzymeA.)

References

    1. Roizman B, Carmichael LE, Deinhardt F, de-The G, Nahmias AJ, et al. Herpesviridae. Definition, provisional nomenclature, and taxonomy. The Herpesvirus Study Group, the International Committee on Taxonomy of Viruses. Intervirology. 1981;16:201–217. - PubMed
    1. Ranneberg-Nilsen T, Dale HA, Luna L, Slettebakk R, Sundheim O, et al. Characterization of human cytomegalovirus uracil DNA glycosylase (UL114) and its interaction with polymerase processivity factor (UL44). J Mol Biol. 2008;381:276–288. - PubMed
    1. Fiehn O. Metabolomics–the link between genotypes and phenotypes. Plant Mol Biol. 2002;48:155–171. - PubMed
    1. Want EJ, Cravatt BF, Siuzdak G. The expanding role of mass spectrometry in metabolite profiling and characterization. Chembiochem. 2005;6:1941–1951. - PubMed
    1. Ritter JB, Wahl AS, Freund S, Genzel Y, Reichl U. Metabolic effects of influenza virus infection in cultured animal cells: Intra- and extracellular metabolite profiling. BMC Syst Biol. 2010;4:61. - PMC - PubMed

Publication types

MeSH terms