. 2011;6(7):e22025.
doi: 10.1371/journal.pone.0022025. Epub 2011 Jul 14.

High-resolution quantification of focal adhesion spatiotemporal dynamics in living cells

Affiliations

High-resolution quantification of focal adhesion spatiotemporal dynamics in living cells

Mathew E Berginski et al. PLoS One. 2011.

Abstract

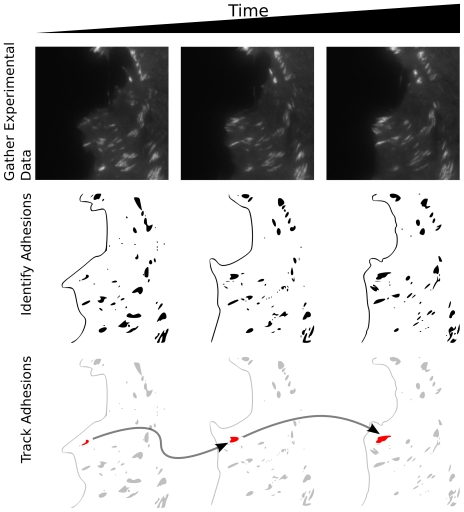
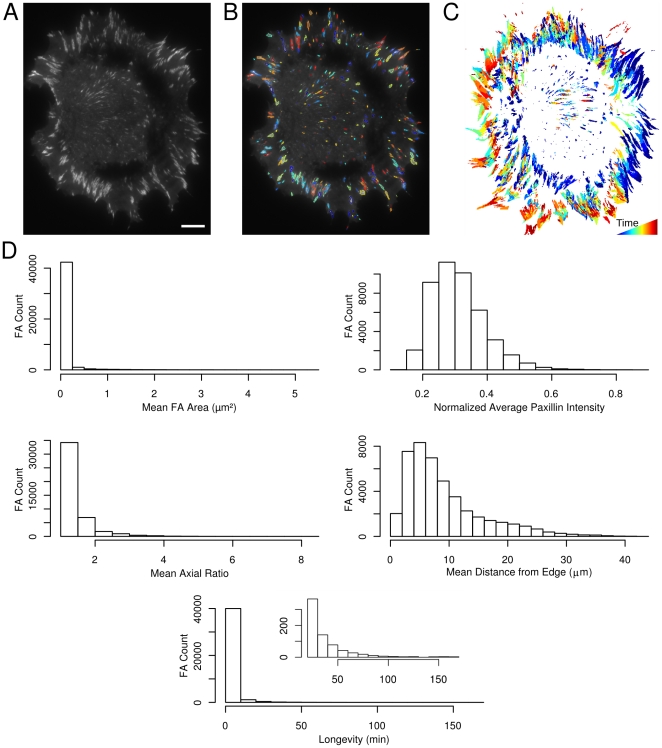
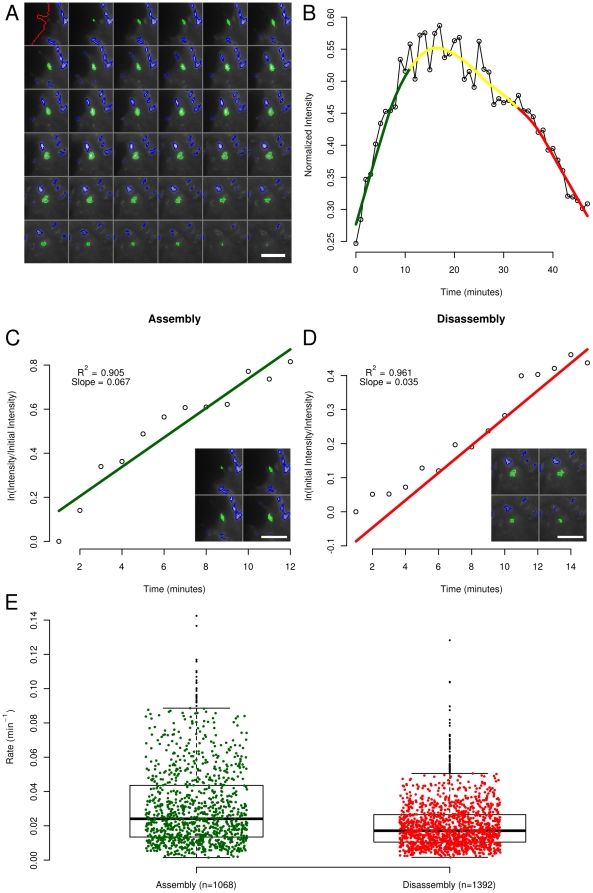
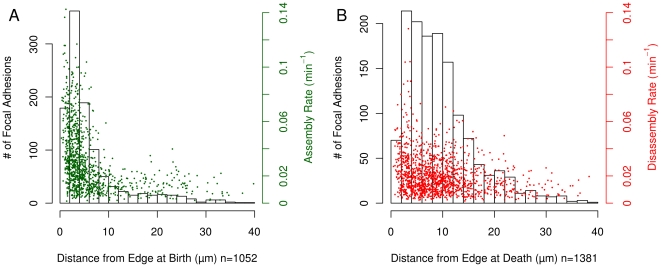
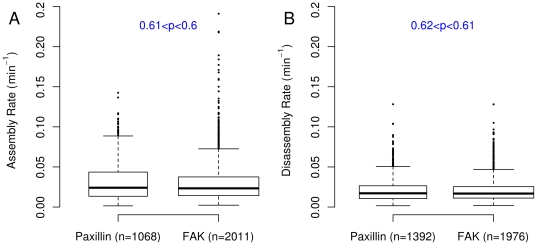
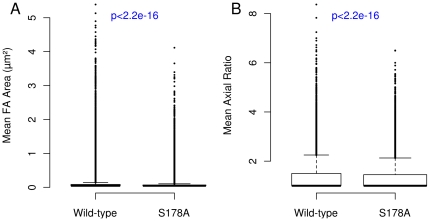
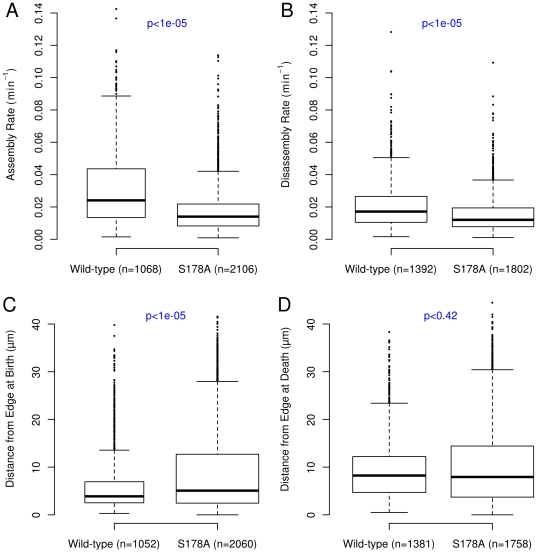
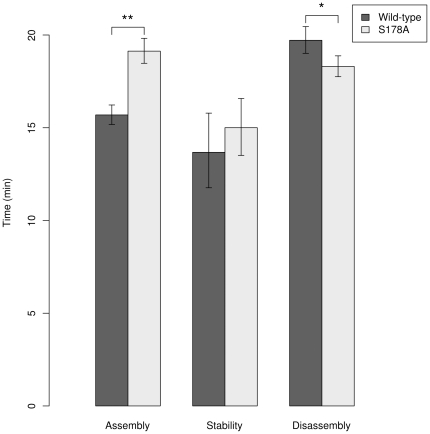
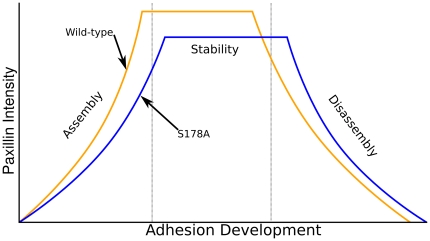
Focal adhesions (FAs) are macromolecular complexes that provide a linkage between the cell and its external environment. In a motile cell, focal adhesions change size and position to govern cell migration, through the dynamic processes of assembly and disassembly. To better understand the dynamic regulation of focal adhesions, we have developed an analysis system for the automated detection, tracking, and data extraction of these structures in living cells. This analysis system was used to quantify the dynamics of fluorescently tagged Paxillin and FAK in NIH 3T3 fibroblasts followed via Total Internal Reflection Fluorescence Microscopy (TIRF). High content time series included the size, shape, intensity, and position of every adhesion present in a living cell. These properties were followed over time, revealing adhesion lifetime and turnover rates, and segregation of properties into distinct zones. As a proof-of-concept, we show how a single point mutation in Paxillin at the Jun-kinase phosphorylation site Serine 178 changes FA size, distribution, and rate of assembly. This study provides a detailed, quantitative picture of FA spatiotemporal dynamics as well as a set of tools and methodologies for advancing our understanding of how focal adhesions are dynamically regulated in living cells. A full, open-source software implementation of this pipeline is provided at http://gomezlab.bme.unc.edu/tools.


Conflict of interest statement

Competing Interests: The authors have declared that no competing interests exist.

Figures

Figure 1
Figure 1. Automating the analysis of focal adhesion images requires a multi-stage pipeline.
The first row shows several representative images of fluorescently labeled Paxillin using TIRF microscopy. In the second row, a cartoon depiction of the segmented adhesions and the cell edge are shown. Identification of the adhesions in each image allows a set of characteristic morphological and fluorescence intensity-based features to be extracted. The third row shows a single adhesion (highlighted in red) being tracked through the short sample time course. The properties of each adhesion are tracked over time, allowing the large scale dynamics of FA to be determined.
Figure 2
Figure 2. Applying quantitative image processing methods to FA images allows comprehensive characterization of FA properties.
(A) One frame from a 200 minute movie of NIH 3T3 cells expressing GFP-Paxillin (the scale bar represents 10 µm). (B) The same cell as in (A), with each adhesion outlined in a different color. (C) The entire set of adhesions in an experiment can be visualized by overlaying the adhesions from each microscopy image using a different color for the set of adhesions at each time point. This example includes the adhesions from 198 images. (D) A range of properties can be extracted from the segmented FA. Five samples are provided. The area histogram was filtered to only include adhesions with areas less than 5 µm2. The axial ratio histogram was filtered to only include adhesions with an axial ratio of 8 or less. The longevity histogram includes all adhesions, while the inset only includes adhesions with longevity greater than 20. The histograms include data from 21 cells.
Figure 3
Figure 3. Automated measurement of focal adhesion dynamics.
(A) Each of the adhesions in the cells is tracked, allowing the position and properties of single adhesions and populations to be assessed. Here a single adhesion (in green), the surrounding adhesions (in blue) and the cell edge (in red) are followed for 49 minutes. The cell edge is only outlined in the first frame. The scale bar is 10 µm. (B) The intensity of EGFP- Paxillin in the tracked adhesion in (A) through time. The green, yellow and red lines are smoothed using the Lowess algorithm and correspond to the assembly, stable and disassembly phases, respectively. (C) The normalized log-linear fit of the Paxillin intensity through time during the assembly phase of the adhesion in part (B). The inset depicts several of the images from which the Paxillin intensity was gathered. (D) The normalized log-linear fit of the Paxillin intensity through time during the disassembly phase of the adhesion in part (B). The inset depicts several of the images from which the Paxillin intensity was gathered. (E) The assembly and disassembly rates for adhesions whose Paxillin intensity curve fits have R2 values of 0.9 or greater. The top and bottom lines of the boxes indicate the 3rd and 1st quartiles respectively, while the bold central lines indicate the median values. The whiskers extend up to 1.5 times the interquartile range.
Figure 4
Figure 4. Spatial properties of FA positions at birth and death.
(A) The majority of adhesions are born within 5 µm of the cell edge and the greatest variance in assembly rates are also observed in this 5 µm band. (B) The distribution of the distance of death location from the cell edge indicates that adhesion disassembly typically occurs along a broader band from the cell edge as compared to the position at adhesion birth. Also, the variance in disassembly rate is roughly the same regardless of the position at adhesion death. This data was collected from 21 EGFP-Paxillin cells.
Figure 5
Figure 5. The assembly and disassembly rates of EGFP-Paxillin and EGFP-FAK adhesions are the same.
The blue numbers in each plot are the p-values of the difference in median values between the EGFP-Paxillin and EGFP-FAK adhesions. P-values were calculated using the bootstrapped confidence intervals with 50000 replicates. Data from 10 cells are included.
Figure 6
Figure 6. The S178A mutation in Paxillin decreases adhesion size and axial ratio.
There are 44685 adhesions in the wild-type and 73305 adhesions in the S178A data sets. The p-values were calculated using the Wilcox Rank Sum test. Data from 9 cells are included in the S178A data set.
Figure 7
Figure 7. The S178A mutation in Paxillin alters adhesion assembly and disassembly.
(A and B) The rate of adhesion assembly and disassembly are significantly decreased by the S178A mutation. The S178A median FA assembly rate is decreased by 42% compared to the wild-type cells, while the median disassembly rate is decreased by 36%. (C and D) The S178A mutation shifts the median adhesion birth location away from the cell edge, but has no effect on the location of cell death. The S178A median adhesion birth position is 31% greater than wild-type median birth position. The median position at adhesion death is decreased by 4% between the S178A and wild-type cells. P-values were calculated in the same manner as in Figure 5.
Figure 8
Figure 8. The lengths of the assembly and disassembly phases in S178A mutant FAs are significantly different from those in the wild-type, while the stability phase lengths are unaffected.
The phase length values include all adhesions where the log-linear models fit with a p-value of 0.05 or less. Error bars indicate 99% confidence intervals on the mean phase length as determined through 50,000 bootstrap samples. A double asterisk (**) indicates p<10−5 and single asterisk (*) indicates p<0.05. Wild-type N Values: Assembly (1068), Stability (465), Disassembly (1392); S178A N Values: Assembly (2106), Stability (870), Disassembly (1802).
Figure 9
Figure 9. Summary of results and conceptual model of how the S178A mutant affects the adhesion life cycle.
Durations and slopes are shown to scale.

References

    1. Geiger B, Spatz JP, Bershadsky AD. Environmental sensing through focal adhesions. Nat Rev Mol Cell Biol. 2009;10:21–33. - PubMed
    1. Lauffenburger DA, Horwitz AF. Cell migration: a physically integrated molecular process. Cell. 1996;84 - PubMed
    1. Ridley AJ, Schwartz MA, Burridge K, Firtel RA, Ginsberg MH, et al. Cell Migration: Integrating Signals from Front to Back. Science. 2003;302 - PubMed
    1. Larsen M, Tremblay ML, Yamada KM. Phosphatases in cell-matrix adhesion and migration. Nat Rev Mol Cell Biol. 2003;4:700–711. - PubMed
    1. Webb DJ, Parsons JT, Horwitz AF. Adhesion assembly, disassembly and turnover in migrating cells - over and over and over again. Nat Cell Biol. 2002;4 - PubMed

Publication types