. 2011;6(7):e22126.
doi: 10.1371/journal.pone.0022126. Epub 2011 Jul 11.

S100B and APP promote a gliocentric shift and impaired neurogenesis in Down syndrome neural progenitors

Affiliations

S100B and APP promote a gliocentric shift and impaired neurogenesis in Down syndrome neural progenitors

Jie Lu et al. PLoS One. 2011.

Abstract

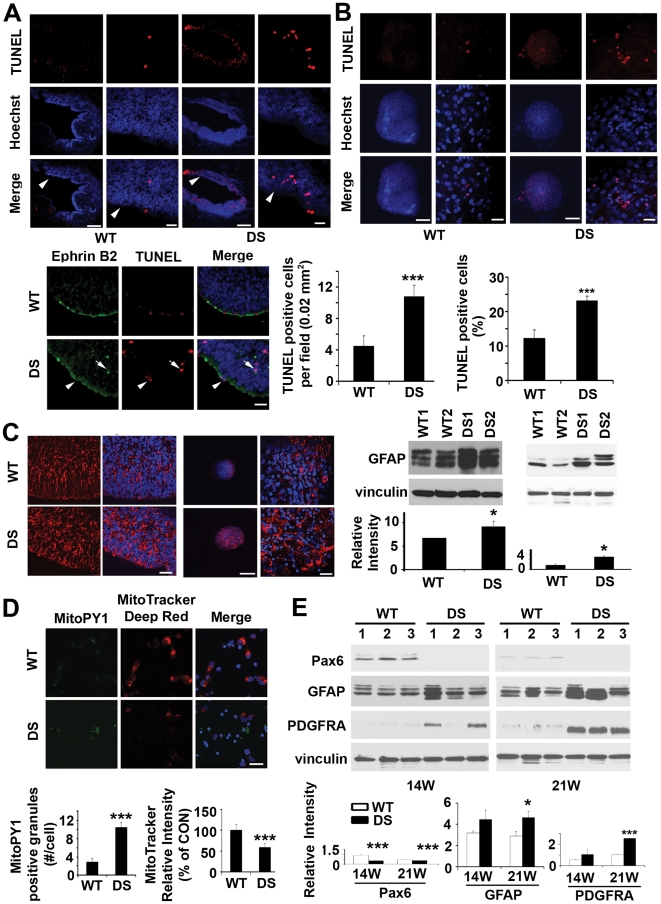
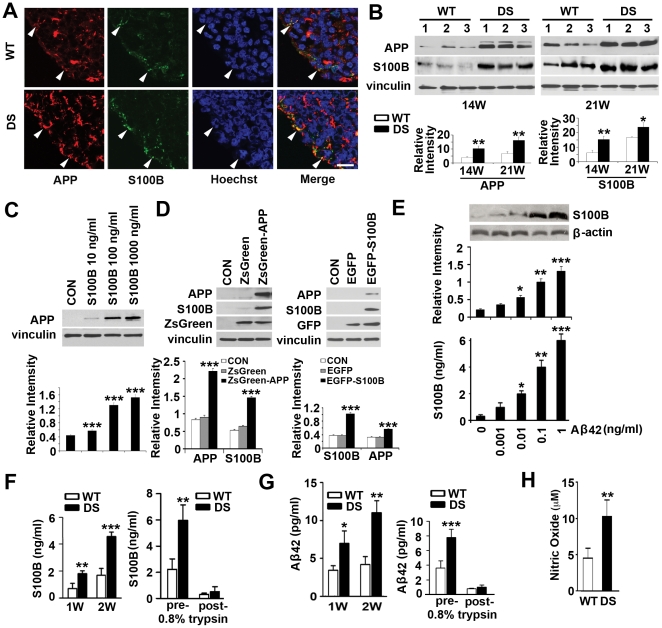
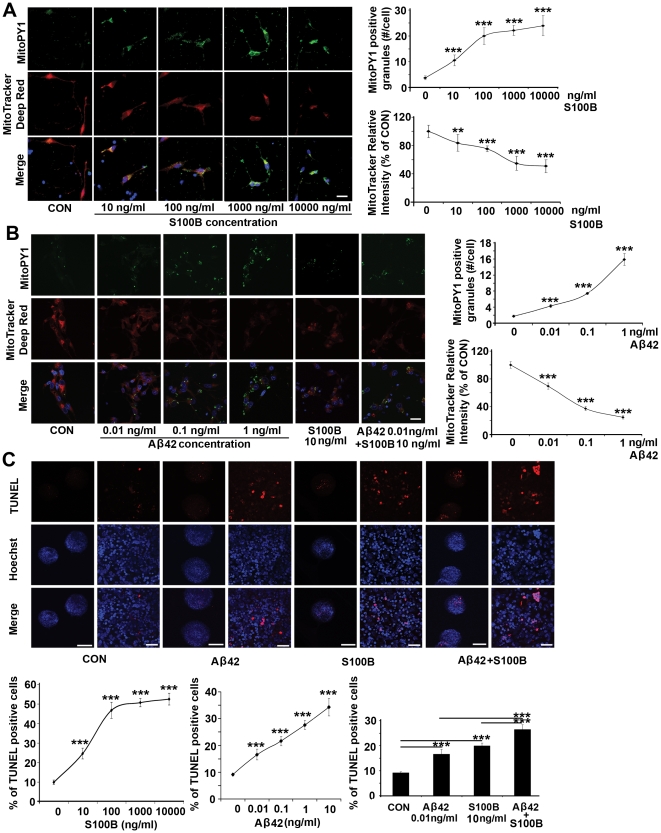
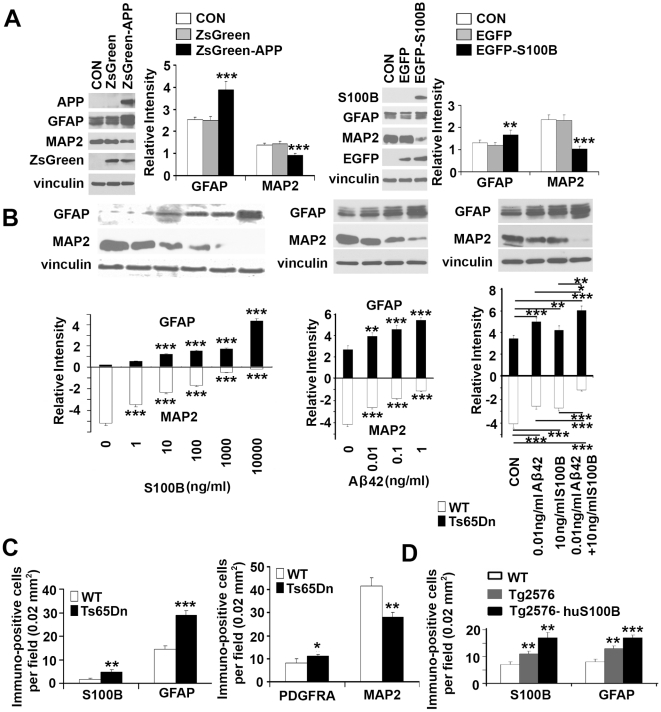
Down syndrome (DS) is a developmental disorder associated with mental retardation (MR) and early onset Alzheimer's disease (AD). These CNS phenotypes are attributed to ongoing neuronal degeneration due to constitutive overexpression of chromosome 21 (HSA21) genes. We have previously shown that HSA21 associated S100B contributes to oxidative stress and apoptosis in DS human neural progenitors (HNPs). Here we show that DS HNPs isolated from fetal frontal cortex demonstrate not only disturbances in redox states within the mitochondria and increased levels of progenitor cell death but also transition to more gliocentric progenitor phenotypes with a consequent reduction in neuronogenesis. HSA21 associated S100B and amyloid precursor protein (APP) levels are simultaneously increased within DS HNPs, their secretions are synergistically enhanced in a paracrine fashion, and overexpressions of these proteins disrupt mitochondrial membrane potentials and redox states. HNPs show greater susceptibility to these proteins as compared to neurons, leading to cell death. Ongoing inflammation through APP and S100B overexpression further promotes a gliocentric HNPs phenotype. Thus, the loss in neuronal numbers seen in DS is not merely due to increased HNPs cell death and neurodegeneration, but also a fundamental gliocentric shift in the progenitor pool that impairs neuronal production.


Conflict of interest statement

Competing Interests: The authors have declared that no competing interests exist.

Figures

Figure 1
Figure 1. Increased apoptosis, gliosis, mitochondria dysfunction and gliocentric cell fate shift in DS HNPs.
(A) Confocal fluorescence photomicrographs demonstrate increased numbers of cells undergoing apoptosis as observed by TUNEL stain (rhodamine, counterstained with Hoechst 33342) along the VZ for DS fetal cortex (18W GA, noted by white arrowheads). Higher magnification images are to the right. The relative number of TUNEL labeled cells is quantified for both WT and DS VZ. (n = 4 for each). Many of the TUNEL positive cells (rhodamine) express the ephrinb2 neural progenitor marker (fluorescein) along the VZ of 18W GA fetal cortex (see white arrowheads in lower panel). (B) The increase in programmed progenitor cell death seen in vivo is also appreciated in vitro in human DS neurospheres after one week of culture. Quantification of TUNEL-positive cells is below (n>5 neurospheres in each experimental sample). (C) Fluorescent photomicrographs demonstrate increased intensity of immunostaining (rhodamine, counterstained with Hoechst 33342) for GFAP along the VZ of fetal 18W GA DS brain compared to normal age-matched controls. Western blot confirms the increase. The upregulation of GFAP (rhodamine) is also found in the DS neurospheres derived from the VZ of 18W GA fetuses after one week of culture, as shown by immunostaining and western blot. (D) Fluorescence photomicrographs by confocal microscopy demonstrate increased intracellular mitochondrial H2O2 production showed by MitoPY1 (fluorescein) staining and disrupted mitochondrial membrane potential showed by decreased MitoTracker deep red staining (rhodamine, counterstained with Hoechst 33342) within DS HNPs compared to WT controls (18W GA) after 24 hours of culture. MitoPY1 localizes to the mitochondria and directly assays H2O2 levels in the organelle. The quantification graphs are showed below. (E) Western blots demonstrate decreased neuroprogenitors shown by pax6 and increased glioprogenitors showed by GFAP and PDGFRA staining in human DS frontal cortex (n = 3 age-matched control and DS fetal tissues, 14W and 21W GA). Quantification is showed below. Scale bars are 200 µm for low magnification and 25 µm for high magnification in A, B and C, 25 µm for D. Data are represented as mean +/− STDEV, * p-value<0.05, ** p-value<0.01, *** p-value<0.001 by two tailed t-test.
Figure 2
Figure 2. Reciprocal up-regulation of secreted S100B, APP and oxidative stress in DS HNPs.
(A) Fluorescent photomicrographs demonstrate increased intensity of staining for both APP (rhodamine) and S100B (fluorescein, counterstained with Hoechst 33342) within DS neural progenitors along the VZ of the 18W GA fetal cortex compared to normal age-matched controls. White arrowheads show the colocalizations of APP and S100B along the VZ. (B) Western blot analyses confirm upregulation of both these proteins within the cortex of the DS brains of multiple independent samples at an age dependent manner (n = 3 age-matched control and DS fetal tissues, 14W and 21W GA). (C) Incubation of S100B (10–1000 ng/ml) for 24 hours in normal cultured HNPs dose-dependently increases APP levels; (D) S100B levels in the cytoplasm are increased with APP overexpression for 4 days, and vice versa, as shown by western blot. (E) Western blot and ELISA assay show a dose-dependent increase in S100B expression and secretion into the culture medium after Aβ42 stimulation for 24 hours. (F) Longer term (1–2 weeks) culturing of DS HNPs results in a progressive increase in the expression of S100B. The increased levels of S100B are largely due to soluble, extracellular S100B as trypsin treatment of the media can degrade the protein. (G) A similar increase in Aβ42 levels is appreciated in DS HNPs cultured over time. Increased levels of Aβ42 are also largely due to soluble, secreted protein that is degraded with trypsin treatment. Prior findings have shown that S100B or amyloid can lead to increased ROS generation. Consistent with these findings, there is an increase of oxidative stress in DS HNPs, as showed by nitric oxide assays (H). Scale bars are 12.5 µm in A; data are represented as mean +/− STDEV, * p-value<0.05, ** p-value<0.01, *** p-value<0.001 by two tailed t-test.
Figure 3
Figure 3. Soluble S100B or Aβ42 treatment promotes mitochondrial H2O2 production, loss in mitochondrial membrane potential and apoptosis in normal cultured HNPs.
(A) S100B exposure for 24 hours dose-dependently increases intracellular mitochondrial H2O2 production within HNPs, as shown by MitoPY1 (fluorescein, counterstained with Hoechst 33342) staining. MitoPY1 localizes to the mitochondria and directly assays H2O2 levels in the organelle. S100B treatment also leads to mitochondrial dysfunction in a dose-dependent fashion, as showed by decreased MitoTracker deep red staining (rhodamine). Results are quantified graphically to the right. (B) A similar trend of increased intracellular mitochondrial H2O2 and decreased mitochondrial membrane function appears after exposure to soluble Aβ42 for 24 hours. The quantification graphs for additive effects of S100B and Aβ42 are showed in Figure S3E. (C) Exposure to S100B or Aβ42 at concentrations comparable to that seen in DS HNPs for 24 hours causes apoptosis (showed by TUNEL staining) in WT cultured HNPs. The graphs below show a dose-dependent increase in apoptosis after S100B, APP or both S100B and APP stimulation (n>5 neurospheres in each experimental trial with at least 3 replicates). Scale bars are 25 µm for A and B; 200 µm for low magnification and 25 µm for high magnification in C; data are represented as mean +/− STDEV, *** p-value<0.001 by two tailed t-test and one-way ANOVA.
Figure 4
Figure 4. Gliocentric shift due to S100B and APP/Aβ42 in DS HNPs.
(A) Lentiviral infections of ZsGreen-APP or transfections of EGFP-S100B constructs into normal HNPs for 4 days promote GFAP and inhibit MAP2 expression, as shown by western blot. (B) Pretreatment of normal, cultured HNPs with increasing concentrations of soluble S100B or Aβ42 for 24 hours shows a dose-dependent increase in GFAP and decrease in MAP2 expression. Co-treatment with S100B and Aβ42 for 24 hours leads to an additive increase in GFAP and decrease in MAP2 expression levels. (C) Quantification graphs from fluorescent photomicrographs (Figure S4A) in the cortex of early postnatal (P0) Ts65Dn mice show increased numbers of immunostaining on glial markers such as S100B, GFAP and PDGFRA, and decreased numbers of neuronal staining with MAP2 compared to WT (n = 3 for each group of mice). A similar increase appears in APP (Tg2576) or APP/S100B (Tg2576-huS100B) overexpressing mice compared to age-matched WT control (Figure S4B and S4C). Data are represented as mean +/− STDEV, * p-value<0.05, ** p-value<0.01, *** p-value<0.001 by two tailed t-test and one-way ANOVA.
Figure 5
Figure 5. RAGE blocking and APP inhibition synergistically reduce oxidative stress, apoptosis and rescue sequential gliocentric cell fate change in DS HNPs.
(A) DS HNPs treated with Anti-RAGE antibody (1 µg/ml) or RAGE antagonist dalteparin sodium (1 IU/ml) for 24 hours show reduced APP expression (left, western blot) and S100B or Aβ42 secretion (right, ELISA). (B) Graphs show the S100B stimulation for 24 hours dose dependently increase H2O2 production and decrease mitochondrial membrane potential which can be blocked by RAGE antibody (1 µg/ml) or dalteparin sodium (1 IU/ml) (Figure S5A). (C) Quantification graph shows the large numbers of TUNEL+ cells in DS HNPs decrease to normal level after Anti-RAGE antibody (1 µg/ml) or dalteparin sodium (1 IU/ml) treatment for 24 hours, and a quantification graph is on the upper left (n>5 neurospheres in each experimental sample) (Figure S5B). (D) DS HNPs are treated with dalteparin sodium and phenserine for 24 h, and quantitative analyses of mitochondrial membrane potential and mitochondrial H2O2 fluorescent intensities are quantified from the photographs (Figure S5C) at three separate dosages (A = dalteparin 0.01 IU/ml, phenserine 0.5 µM, or dalteparin 0.01 IU/ml+phenserine 0.5 µM; B = dalteparin 0.1 IU/ml, phenserine 5 µM, or dalteparin 0.1 IU/ml+phenserine 5 µM; C = dalteparin 1 IU/ml, phenserine 50 µM, or dalteparin 1 IU/ml+phenserine 50 µM). The graph shows a synergistic effect of the two drugs with a presumed level of toxicity at the highest concentrations. (E) Pretreatment with phenserine, dalteparin or phenserine+dalteparin for 24 hours reduces GFAP and APP levels but increases MAP2 levels in DS HNPs. Western blot analyses show significant reduction of GFAP and APP and increase of MAP2 expression levels following treatment. Band intensities are graphically quantified below. (F) Quantification graph of TUNEL staining (Figure S5D) from DS HNPs treated with dalteparin sodium and phenserine for 24 hours shows decreased TUNEL+ cells compared to controls (n>5 neurospheres in each experimental sample). Data are represented as mean +/− STDEV, * p-value<0.05, ** p-value<0.01, *** p-value<0.001 by one-way ANOVA.

References

    1. Wiseman FK, Alford KA, Tybulewicz VL, Fisher EM. Down syndrome–recent progress and future prospects. Hum Mol Genet. 2009;18:R75–83. - PMC - PubMed
    1. Contestabile A, Fila T, Ceccarelli C, Bonasoni P, Bonapace L, et al. Cell cycle alteration and decreased cell proliferation in the hippocampal dentate gyrus and in the neocortical germinal matrix of fetuses with Down syndrome and in Ts65Dn mice. Hippocampus. 2007;17:665–678. - PubMed
    1. Guidi S, Bonasoni P, Ceccarelli C, Santini D, Gualtieri F, et al. Neurogenesis impairment and increased cell death reduce total neuron number in the hippocampal region of fetuses with Down syndrome. Brain Pathol. 2008;18:180–197. - PMC - PubMed
    1. Busciglio J, Pelsman A, Wong C, Pigino G, Yuan M, et al. Altered metabolism of the amyloid beta precursor protein is associated with mitochondrial dysfunction in Down's syndrome. Neuron. 2002;33:677–688. - PubMed
    1. Seidl R, Bidmon B, Bajo M, Yoo PC, Cairns N, et al. Evidence for apoptosis in the fetal Down syndrome brain. J Child Neurol. 2001;16:438–442. - PubMed

Publication types

MeSH terms