

Transcriptional and Translational Downregulation of Thioredoxin Interacting Protein Is Required for Metabolic Reprogramming during G(1)
- PMID: 21779470
- PMCID: PMC3092257
- DOI: 10.1177/1947601910389604
Transcriptional and Translational Downregulation of Thioredoxin Interacting Protein Is Required for Metabolic Reprogramming during G(1)
Abstract
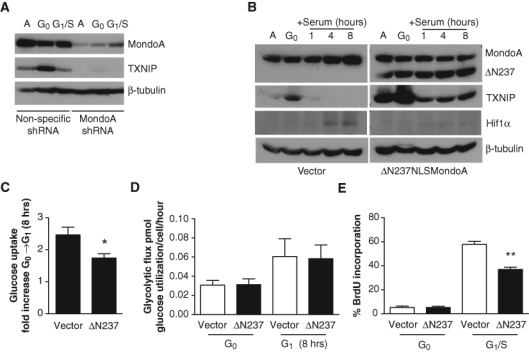
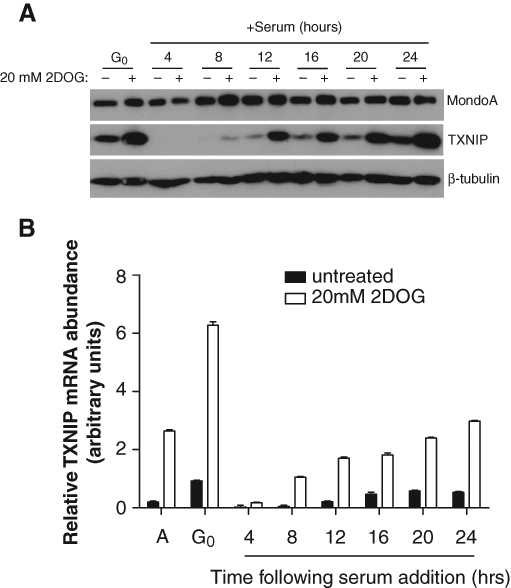
Growth factor signaling drives increased glucose uptake and glycolysis-the Warburg effect-that supports macromolecular synthesis necessary for cell growth and proliferation. Thioredoxin interacting protein (TXNIP), a direct and glucose-induced transcriptional target of MondoA, is a potent negative regulator of glucose uptake and utilization. Thus, TXNIP may inhibit cell growth by restricting substrate availability for macromolecular synthesis. To determine TXNIP's contribution to metabolic reprogramming, we examined MondoA and TXNIP as cells exit quiescence and enter G(1). Serum stimulation of quiescent immortal diploid fibroblasts resulted in an acute upregulation of glucose uptake and glycolysis coinciding with downregulation of TXNIP expression. Ectopic expression of either MondoA or TXNIP restricted cell growth by blocking glucose uptake. Mechanistically, Ras-MAPK and PI3K/Akt signaling inhibit TXNIP translation and MondoA-dependent TXNIP transcription, respectively. We propose that the coordinated downregulation of MondoA transcriptional activity at the TXNIP promoter and inhibition of TXNIP translation are key components of metabolic reprogramming required for cells to exit quiescence.
Keywords: MondoA; TXNIP; metabolism; quiescence; transcription.
Conflict of interest statement
The author(s) declared no potential conflicts of interest with respect to the authorship and/or publication of this article.
Figures


Similar articles
-
Protein synthesis inhibitors stimulate MondoA transcriptional activity by driving an accumulation of glucose 6-phosphate.Cancer Metab. 2020 Dec 4;8(1):27. doi: 10.1186/s40170-020-00233-6. Cancer Metab. 2020. PMID: 33292639 Free PMC article.
-
Glutamine-dependent anapleurosis dictates glucose uptake and cell growth by regulating MondoA transcriptional activity.Proc Natl Acad Sci U S A. 2009 Sep 1;106(35):14878-83. doi: 10.1073/pnas.0901221106. Epub 2009 Aug 17. Proc Natl Acad Sci U S A. 2009. PMID: 19706488 Free PMC article.
-
MondoA-Mlx transcriptional activity is limited by mTOR-MondoA interaction.Mol Cell Biol. 2015 Jan;35(1):101-10. doi: 10.1128/MCB.00636-14. Epub 2014 Oct 20. Mol Cell Biol. 2015. PMID: 25332233 Free PMC article.
-
Interactions between Myc and MondoA transcription factors in metabolism and tumourigenesis.Br J Cancer. 2015 Dec 1;113(11):1529-33. doi: 10.1038/bjc.2015.360. Epub 2015 Oct 15. Br J Cancer. 2015. PMID: 26469830 Free PMC article. Review.
-
Research Progress of TXNIP as a Tumor Suppressor Gene Participating in the Metabolic Reprogramming and Oxidative Stress of Cancer Cells in Various Cancers.Front Oncol. 2020 Oct 21;10:568574. doi: 10.3389/fonc.2020.568574. eCollection 2020. Front Oncol. 2020. PMID: 33194655 Free PMC article. Review.
Cited by
-
Multiomic characterization of oncogenic signaling mediated by wild-type and mutant RIT1.Sci Signal. 2021 Nov 30;14(711):eabc4520. doi: 10.1126/scisignal.abc4520. Epub 2021 Nov 30. Sci Signal. 2021. PMID: 34846918 Free PMC article.
-
Redox homeostasis and cell cycle activation mediate beta-cell mass expansion in aged, diabetes-prone mice under metabolic stress conditions: Role of thioredoxin-interacting protein (TXNIP).Redox Biol. 2020 Oct;37:101748. doi: 10.1016/j.redox.2020.101748. Epub 2020 Oct 7. Redox Biol. 2020. PMID: 33128997 Free PMC article.
-
Protein synthesis inhibitors stimulate MondoA transcriptional activity by driving an accumulation of glucose 6-phosphate.Cancer Metab. 2020 Dec 4;8(1):27. doi: 10.1186/s40170-020-00233-6. Cancer Metab. 2020. PMID: 33292639 Free PMC article.
-
Insulin-like growth factors and aging: lessons from Laron syndrome.Front Endocrinol (Lausanne). 2023 Oct 24;14:1291812. doi: 10.3389/fendo.2023.1291812. eCollection 2023. Front Endocrinol (Lausanne). 2023. PMID: 37941907 Free PMC article. Review.
-
Thioredoxin interacting protein (TXNIP) is a novel tumor suppressor in thyroid cancer.Mol Cancer. 2014 Mar 19;13:62. doi: 10.1186/1476-4598-13-62. Mol Cancer. 2014. PMID: 24645981 Free PMC article.
References
-
- Frauwirth KA, Riley JL, Harris MH, et al. The CD28 signaling pathway regulates glucose metabolism. Immunity. 2002;16:769-77 - PubMed
-
- Bruszewski WB, Bruszewski JA, Tonnu H, et al. Early mitogen-induced metabolic events essential to proliferation of human T lymphocytes: dependence of specific events on the influence of adherent accessory cells. J Immunol. 1984;132:2837-43 - PubMed
Grants and funding
LinkOut - more resources
Full Text Sources
Other Literature Sources
Research Materials