. 2011 Jan;2(1):20-30.
doi: 10.1177/1947601911402680.

The Tumor Suppressor, p190RhoGAP, Differentially Initiates Apoptosis and Confers Docetaxel Sensitivity to Breast Cancer Cells

Affiliations

The Tumor Suppressor, p190RhoGAP, Differentially Initiates Apoptosis and Confers Docetaxel Sensitivity to Breast Cancer Cells

Kirsten Ludwig et al. Genes Cancer. 2011 Jan.

Abstract

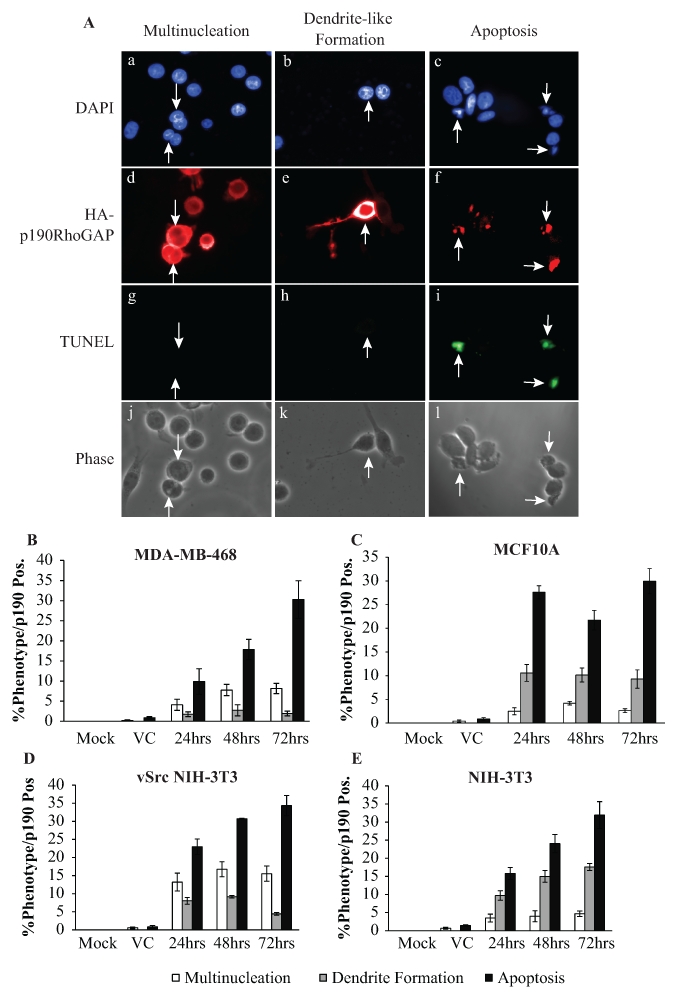
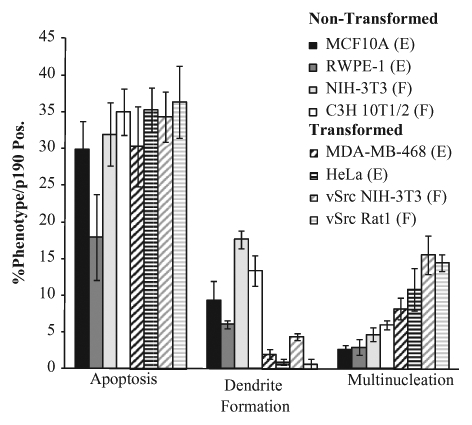
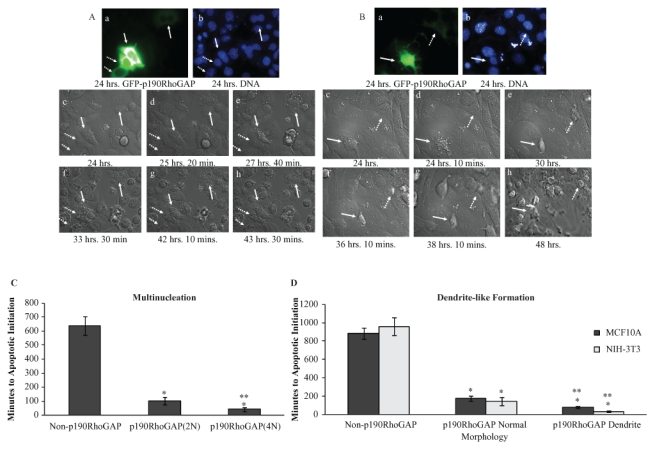
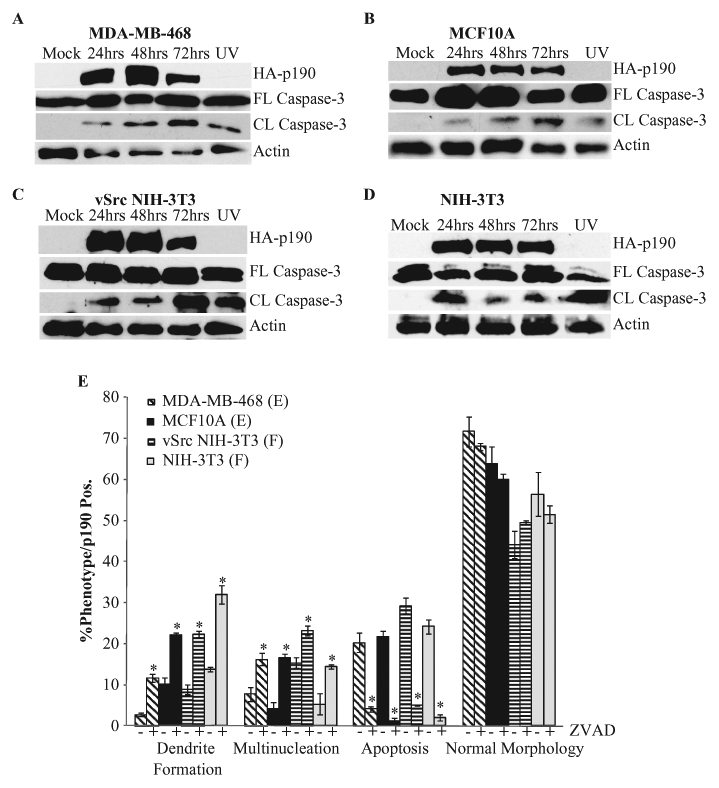
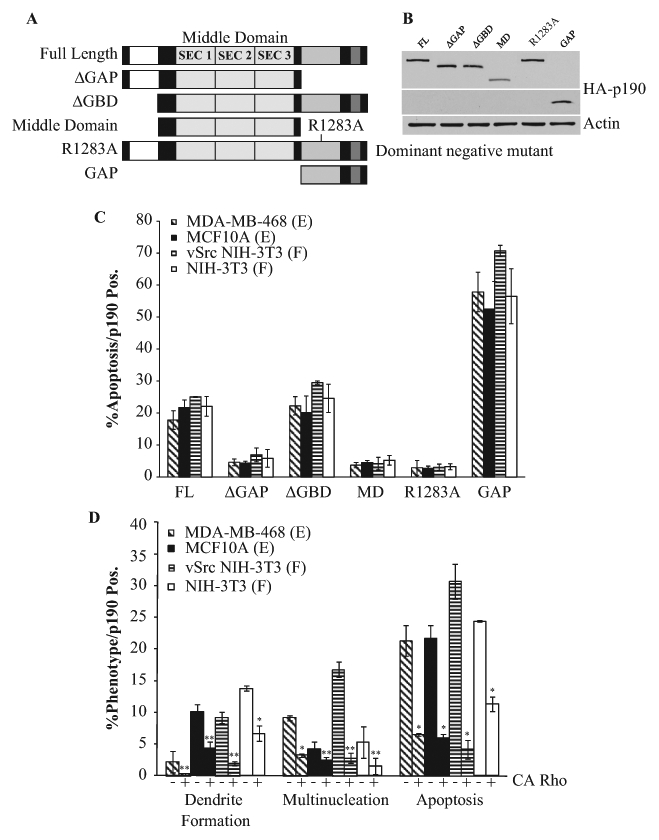
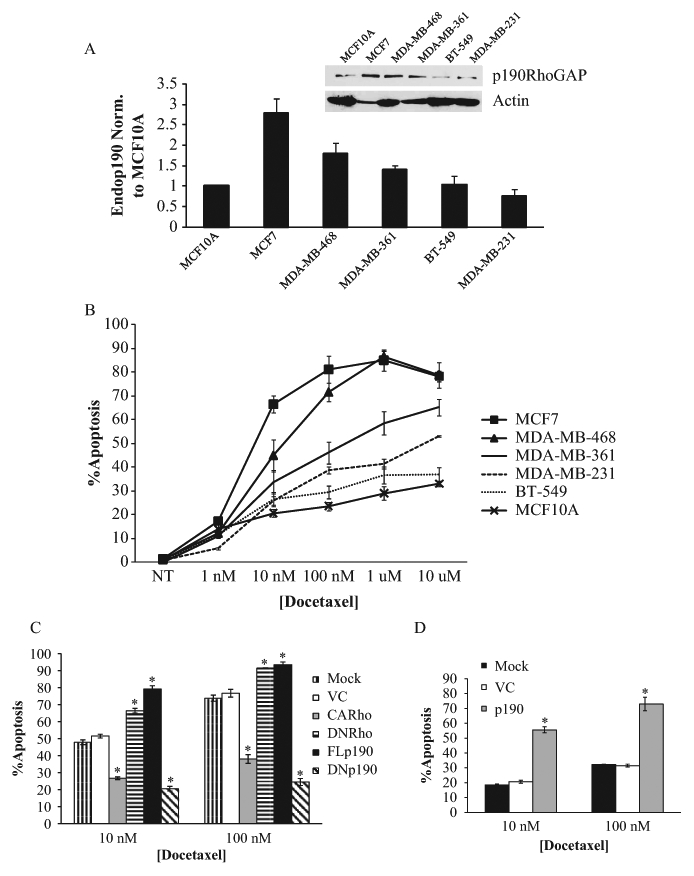
p190RhoGAP (p190) is a negative regulator of RhoGTPases and a putative tumor suppressor, whose mechanism of tumor suppression is poorly defined. Ectopic expression of p190 induces various morphological phenotypes, including multinucleation, dendrite-like formation, and chromatin condensation, suggesting an involvement in apoptosis. We examined the possibility that p190 can function as a tumor suppressor by regulating induction of apoptosis. We show that the predominant phenotype of p190 overexpression in a variety of cell lines is apoptosis, which is mediated through p190's regulation of Rho and caspases. The secondary phenotypes, multinucleation and dendrite-like formation, are determined by transformation status, not cell lineage, and appear to be intermediate phenotypes in the p190-induced apoptotic pathway. Finally, we show that p190 levels can regulate the apoptotic response of breast cancer cell lines to docetaxel through its regulation of Rho. Together, these findings suggest that one mechanism by which p190 can mediate its tumor-suppressive function is through regulation of Rho-activated cell death pathways and that this function can be exploited to optimize the action of cytoskeletal-based chemotherapeutics, such as the taxanes.

Keywords: apoptosis; dendrite; docetaxel; multinucleation; p190RhoGAP.


Conflict of interest statement

The author(s) declared no potential conflicts of interest with respect to the authorship and/or publication of this article.

Figures

Figure 1.
Figure 1.
p190RhoGAP overexpression leads to apoptosis. (A) Immunofluorescent images of MDA-MB-468 cells transiently overexpressing HA-p190 represent the 3 observed phenotypes: multinucleation, dendrite-like formation, and apoptosis. Panels a-c: DAPI-stained DNA; panels d-f: triple HA-tagged p190; panels g-i: TUNEL; and panels j-l: phase. Arrows identify p190-overexpressing cells that are multinucleated (panels a, d, g, and j), dendritic-like (panels b, e, h, and k), or apoptotic (panels c, f, i, and l). (B-E) Quantitation of the respective phenotypes observed in mock-treated, vector control (VC), or p190-transfected MDA-MB-468 (B), MCF10A (C), vSrcNIH3T3 (D), and NIH3T3 (E) cells. Results are expressed as the mean percentage of total cells (mock or VC) or cells positive for HA-p190 that exhibited the observed phenotypes ± standard error of the mean (SEM) (n > 3).
Figure 2.
Figure 2.
The secondary phenotype of p190 overexpression is transformation dependent, not cell type dependent. Quantitation of the respective phenotypes observed in the indicated cell lines overexpressing p190 for 72 hours. Cells were transfected and analyzed as in Figure 1. Results are expressed as the mean percentage of cells positive for HA-p190 that exhibited the observed phenotypes ± SEM (n > 3). E = epithelial cell; F = fibroblast.
Figure 3.
Figure 3.
p190-induced multinucleation and dendrite-like formation can result in apoptosis. (A) Still images from real-time microscopy of MDA-MB-468 multinucleated cells undergoing apoptosis. Panel a: GFP-tagged p190 24 hours post transfection. Solid arrows indicate p190 multinucleated cells; dashed arrows indicate p190 mononucleated cells. Panel b: Hoechst 33342–stained images of DNA taken 24 hours post transfection. Panels c-h: DIC images taken at designated times. (B) Still images from real-time microscopy of a NIH-3T3 dendritic cell undergoing apoptosis. Panel a: GFP-tagged p190 24 hours post transfection. The solid arrow indicates a p190 dendritic cell, and the dashed arrow indicates a p190 cell with normal morphology. Panel b: Hoechst 33342–stained images of DNA taken 24 hours post transfection. Panels c-h: DIC images taken at designated times. (C) Multinucleated, p190-overexpressing MDA-MB-468 cells initiate apoptosis more rapidly than p190 mononucleated cells or nonoverexpressors. The first image, 24 hours post transfection, was defined as time zero, and a cell was measured as positive for apoptotic initiation at the first sign of cellular condensation. Cells were grouped as non–p190-overexpressing (normal, n = 25), p190-overexpressing mononucleated (2N, n = 14), or p190-overexpressing multinucleated (4N or greater, n = 7), and results are expressed as the mean time in minutes ± SEM. *P < 0.005 as compared to non–p190 overexpressing. **P < 0.05 as compared to p190-overexpressing mononucleated (2N). (D) Dendritic, p190-overexpressing NIH-3T3 or MCF10A cells initiate apoptosis more rapidly than p190 normal morphology or non–p190-overexpressing cells. Cells (NIH-3T3, MCF10A) were grouped as non–p190-overexpressing (normal, n = 23, 28), p190-overexpressing mononucleated normal morphology (n = 12, 7), or p190-overexpressing dendritic (n = 8, 4), and results are expressed as the mean time in minutes ± SEM. Statistical significance was determined within individual cell lines. *P < 0.005 as compared to non–p190 overexpressing. **P < 0.05 as compared to p190-overexpressing normal morphology. Images were also taken of vSrc NIH-3T3 and vSrc Rat1 cells; however, all cells began apoptosis within 2 hours of the time course, whether or not they had been transfected with p190RhoGAP, most likely due to the proapoptotic nature of vSrc.
Figure 4.
Figure 4.
p190-induced apoptosis is caspase dependent. (A) MDA-MB-468 cells were transfected with HA-p190 or mock treated, and extracts were subjected to Western blotting as described in Materials and Methods. UV-treated cells were used as a positive control for caspase cleavage. Mock and UV-treated cells were collected at the 48-hour time point. (B-D) MCF10A (B), vSrc NIH-3T3 (C), and NIH-3T3 (D) cells were treated as in A. (E) Cells were transiently transfected with HA-tagged p190. One hour post transfection, cells were treated with 50 µM Z-VAD-FMK (BD Pharmingen) and scored for the respective phenotype 47 hours later. Results are expressed as mean percentage of p190-overexpressing cells that exhibited the indicated phenotype ± SEM (n > 3). Statistical significance was determined within individual cell lines. *P < 0.005 comparing Z-VAD treated to Z-VAD nontreated partner.
Figure 5.
Figure 5.
p190-induced phenotypes are Rho dependent. (A) Diagram of the p190RhoGAP mutants: Full-length (FL), ΔGAP, ΔGBD, Middle Domain (MD), dominant negative GAP inactive R1283A, and GAP-only domain (GAP). (B) Western blot analysis of HA-p190RhoGAP mutants: MDA-MB-468 cells were transfected with plasmids encoding the indicated mutants of p190, and 48 hours later, cell lysates were immunoblotted with anti-HA antibody. (C) Effect of p190 mutations on induction of apoptosis. Indicated cells were transfected and analyzed 48 hours later as in Figure 1. Results are expressed as the mean percentage of p190-overexpressing cells that were TUNEL positive ± SEM (n > 3). (D) Rescue of p190-induced phenotypes by CARho. Indicated cells were cotransfected with equivalent molar amounts of p190 and CARho (Q63L) or with p190RhoGAP alone and cultured for 48 hours. Where indicated, only cells expressing FLp190 alone or both FLp190 and CARho were assessed for apoptosis, multinucleation, or dendrite-like formation. Results are expressed as the mean percentage of HA-p190– or HA-p190/CARho–expressing cells that exhibited the indicated phenotype ± SEM (n > 3). Statistical significance is determined within individual cell lines. *P < 0.005 or **P < 0.05, comparing presence of CARho to its absence in p190-overexpressing cells.
Figure 6.
Figure 6.
p190 confers docetaxel sensitivity through Rho in breast cancer cell lines. (A) Quantitation of levels of endogenous p190 in the indicated cell lines. p190 levels were quantified as described in Materials and Methods. Values were related to Actin and then normalized to p190 levels in MCF10A cells, which were set to 1. Results are expressed as the mean fold over MCF10A levels ± SEM (n > 3). Inset: Representative immunoblot of endogenous p190 in the indicated breast cancer cell lines. (B) Quantitation of docetaxel-induced apoptosis in breast cancer cells. Indicated cells were treated with increasing amounts of docetaxel for 24 hours, and apoptosis was determined by TUNEL immunofluorescence. Results are expressed as the mean percentage of apoptotic cells ± SEM (n > 3). (C) Quantitation of apoptotic MDA-MB-468 cells transiently overexpressing mutants of Rho or p190 and treated with docetaxel. MDA-MB-468 cells were mock treated or transfected with VC-, CARho-, DNRho-, FLp190-, or DNp190-encoding plasmids. Twenty-four hours later, cells were treated with 10 nM or 100 nM docetaxel for another 24 hours. Apoptosis was determined by TUNEL immunofluorescence. Results are expressed as the mean percentage of total cells (VC) or cells overexpressing p190 or Rho that were apoptotic ± SEM (n > 3). *P < 0.005 as compared to VC. (D) Quantitation of apoptosis in MDA-MB-231 cells transiently overexpressing p190RhoGAP and treated with docetaxel. MDA-MB-231 cells were mock treated or transfected with VC or p190 plasmids. Twenty-four hours later, cells were treated with 10 nM or 100 nM docetaxel for another 24 hours. Apoptosis was determined by TUNEL immunofluorescence. Results are expressed as the mean percentage of total cells (mock or VC) or cells positive for HA-p190 that were apoptotic ± SEM (n > 3). *P < 0.005 as compared to mock treated.

Similar articles

Cited by

References

    1. Hall A. The cytoskeleton and cancer. Cancer Metastasis Rev. 2009;28(1-2):5-14 - PubMed
    1. Heasman SJ, Ridley AJ. Mammalian Rho GTPases: new insights into their functions from in vivo studies. Nat Rev Mol Cell Biol. 2008;9(9):690-701 - PubMed
    1. Kishi K, Sasaki T, Kuroda S, Itoh T, Takai Y. Regulation of cytoplasmic division of Xenopus embryo by rho p21 and its inhibitory GDP/GTP exchange protein (rho GDI). J Cell Biol. 1993;120(5):1187-95 - PMC - PubMed
    1. Jalink K, van Corven EJ, Hengeveld T, Morii N, Narumiya S, Moolenaar WH. Inhibition of lysophosphatidate- and thrombin-induced neurite retraction and neuronal cell rounding by ADP ribosylation of the small GTP-binding protein Rho. J Cell Biol. 1994;126(3):801-10 - PMC - PubMed
    1. Aznar S, Fernandez-Valeron P, Espina C, Lacal JC. Rho GTPases: potential candidates for anticancer therapy. Cancer Lett. 2004;206(2):181-91 - PubMed

LinkOut - more resources