. 2011 Jun;5(3):253-9.
doi: 10.4162/nrp.2011.5.3.253. Epub 2011 Jun 21.

Survey of American food trends and the growing obesity epidemic

Affiliations

Survey of American food trends and the growing obesity epidemic

Qin Shao et al. Nutr Res Pract. 2011 Jun.

Abstract

The rapid rise in the incidence of obesity has emerged as one of the most pressing global public health issues in recent years. The underlying etiological causes of obesity, whether behavioral, environmental, genetic, or a combination of several of them, have not been completely elucidated. The obesity epidemic has been attributed to the ready availability, abundance, and overconsumption of high-energy content food. We determined here by Pearson's correlation the relationship between food type consumption and rising obesity using the loss-adjusted food availability data from the United States Department of Agriculture (USDA) Economic Research Services (ERS) as well as the obesity prevalence data from the Behavioral Risk Factor Surveillance System (BRFSS) and the National Health and Nutrition Examination Survey (NHANES) at the Centers for Disease Control and Prevention (CDC). Our analysis showed that total calorie intake and consumption of high fructose corn syrup (HFCS) did not correlate with rising obesity trends. Intake of other major food types, including chicken, dairy fats, salad and cooking oils, and cheese also did not correlate with obesity trends. However, our results surprisingly revealed that consumption of corn products correlated with rising obesity and was independent of gender and race/ethnicity among population dynamics in the U.S. Therefore, we were able to demonstrate a novel link between the consumption of corn products and rising obesity trends that has not been previously attributed to the obesity epidemic. This correlation coincides with the introduction of bioengineered corns into the human food chain, thus raising a new hypothesis that should be tested in molecular and animal models of obesity.

Keywords: Obesity; bioengineered; corn product; food trend; genetically modified.


Figures

Fig. 1
Fig. 1
Comparison of rising obesity trends of NHANES and BRFSS datasets. Alignment of the NHANES and BRFSS obesity trend datasets was performed to find the optimal correspondence. The left ordinate indicates the obesity prevalence by median %; and the right ordinate shows the average daily per capita calories consumed for each food type. The rising obesity trends are similar between the NHANES and BRFSS datasets. Open circles (○) are BRFSS; and closed circles (●) are NHANES obesity trends data with BMI ≥ 30 from their respective datasets.
Fig. 2
Fig. 2
Food types showing no correlation with rising obesity trends. The left ordinate indicates the obesity prevalence by median %; and the right ordinate shows the average daily per capita calories consumed for each indicated food type. Rising obesity did not overlap with the trends in consumption of the indicated food types. Open squares (□), obesity trends data with BMI > 30; and closed circles (●), food type.
Fig. 3
Fig. 3
Regression analysis of the relationship between food type consumption and obesity trends by Pearson's correlation. Regression analysis by Pearson's correlation was performed to determine the relationship between obesity trends and the average daily per capita calories consumed for various food types. The left ordinate indicates the obesity prevalence by median %; and the right ordinate shows the average daily per capita calories consumed for each food type. Open squares (□), obesity trends data with BMI > 30; and closed circles (●), food type.
Fig. 4
Fig. 4
Trends in corn consumption and rising obesity. (A) Relationship of corn product consumption and obesity prevalence between 1970 and 1994. Obesity prevalence from NHANES I (1971-1975), II (1976-1980), and III (1988-1994) were plotted against corn product consumption, revealing the lack of overlap in the trends of these data. Open squares (□), obesity trends data with BMI > 30; and closed circles (♦), corn products. (B) Relationship between rising obesity and rate of GM corn adoption in U.S. between 2000 and 2008. Rate of adoption of GM corn by farmers represented as the acreage of farms planted with GM corn as a percent of total acreage of corn planted in the U.S. was plotted against rising obesity trends. Open squares (□), obesity trends data with BMI > 30; and closed circles (▴), GM corn.
Fig. 5
Fig. 5
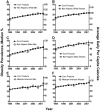
Correlation of corn products intake with NHANES obesity prevalence data stratified by race/ethnicity and gender. Obesity prevalence data stratified by race/ethnicity and gender from NHANES III (1988-1994), NHANES (1999-2000), (2001-2002), (2003-2004), (2005-2006), and (2007-2008) were plotted against corn product consumption between 1995 and 2008. Open squares (□), obesity trends data with BMI ≥ 30; and closed circles (●), average daily per capita corn products intake in calories. Alignment was performed for the relationship of rising obesity with corn product consumption between 1995 and 2008 for non-Hispanic white men (A) and women (B); non-Hispanic black men (C) and women (D); and Mexican-American men (E) and women (F).

References

    1. Kelly T, Yang W, Chen CS, Reynolds K, He J. Global burden of obesity in 2005 and projections to 2030. Int J Obes (Lond) 2008;32:1431–1437. - PubMed
    1. Popkin BM. Recent dynamics suggest selected countries catching up to US obesity. Am J Clin Nutr. 2010;91:284S–288S. - PMC - PubMed
    1. Flegal KM, Carroll MD, Ogden CL, Curtin LR. Prevalence and trends in obesity among US adults, 1999-2008. JAMA. 2010;303:235–241. - PubMed
    1. Pomp D, Mohlke KL. Obesity genes: so close and yet so far... J Biol. 2008;7:36. - PMC - PubMed
    1. Atkinson RL. Viruses as an etiology of obesity. Mayo Clin Proc. 2007;82:1192–1198. - PubMed