

Critical role of chemokine (C-C motif) receptor 2 (CCR2) in the KKAy + Apoe -/- mouse model of the metabolic syndrome
- PMID: 21779871
- PMCID: PMC4430553
- DOI: 10.1007/s00125-011-2248-8
Critical role of chemokine (C-C motif) receptor 2 (CCR2) in the KKAy + Apoe -/- mouse model of the metabolic syndrome
Abstract
Aims/hypothesis: Chemokines and their receptors such as chemokine (C-C motif) receptor 2 (CCR2) may contribute to the pathogenesis of the metabolic syndrome via their effects on inflammatory monocytes. Increased accumulation of CCR2-driven inflammatory monocytes in epididymal fat pads is thought to favour the development of insulin resistance. Ultimately, the resulting hyperglycaemia and dyslipidaemia contribute to development of the metabolic syndrome complications such as cardiovascular disease and diabetic nephropathy. Our goal was to elucidate the role of CCR2 and inflammatory monocytes in a mouse model that resembles the human metabolic syndrome.
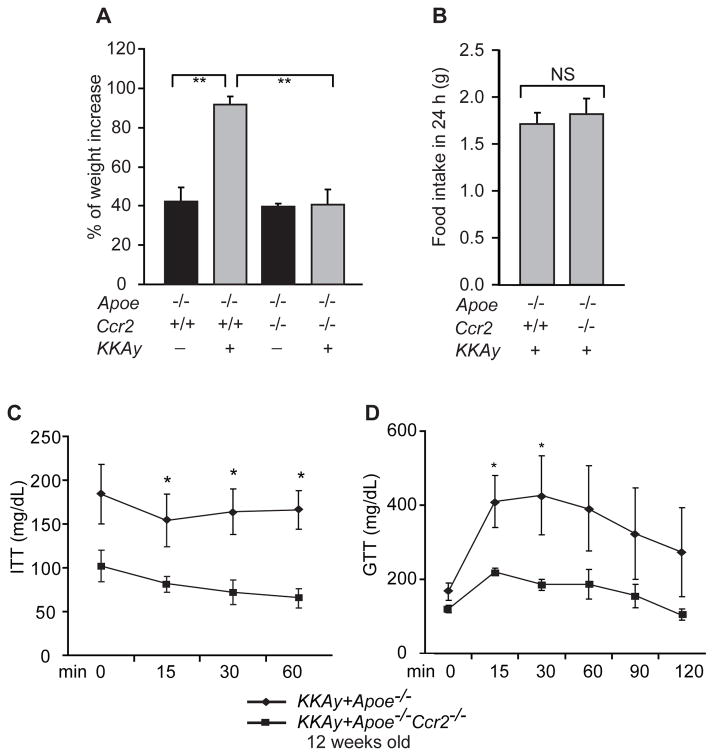
Methods: We generated a model of the metabolic syndrome by backcrossing KKAy ( + ) with Apoe ( -/- ) mice (KKAy ( + ) Apoe ( -/- )) and studied the role of CCR2 in this model system.
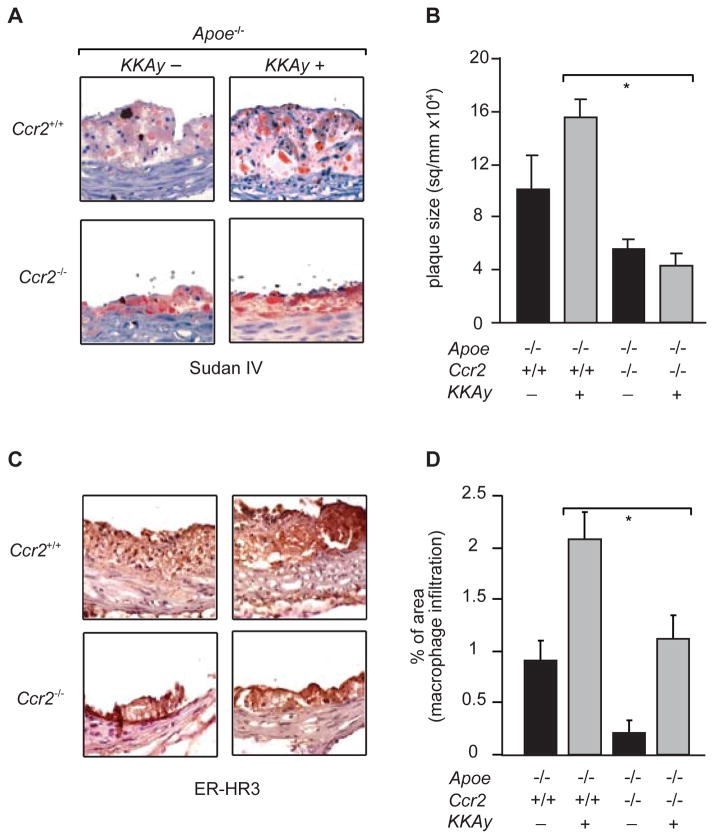
Results: KKAy ( + ) Apoe ( -/- ) mice were characterised by the presence of obesity, insulin resistance, dyslipidaemia and increased systemic inflammation. This model also manifested two complications of the metabolic syndrome: atherosclerosis and diabetic nephropathy. Inactivation of Ccr2 in KKAy (+) Apoe ( -/- ) mice protected against the metabolic syndrome, as well as atherosclerosis and diabetic nephropathy. This protective phenotype was associated with a reduced number of inflammatory monocytes in the liver and muscle, but not in the epididymal fat pads; circulating levels of adipokines such as leptin, resistin and adiponectin were also not reduced. Interestingly, the proportion of inflammatory monocytes in the liver, pancreas and muscle, but not in the epididymal fat pads, correlated significantly with peripheral glucose levels.
Conclusions/interpretation: CCR2-driven inflammatory monocyte accumulation in the liver and muscle may be a critical pathogenic factor in the development of the metabolic syndrome.
Figures


References
-
- Ford ES, Giles WH, Dietz WH. Prevalence of the metabolic syndrome among US adults: findings from the third National Health and Nutrition Examination Survey. Jama. 2002;287:356–359. - PubMed
-
- Haffner SM. The metabolic syndrome: inflammation, diabetes mellitus, and cardiovascular disease. Am J Cardiol. 2006;97:3A–11A. - PubMed
-
- Hayden MR, Whaley-Connell A, Sowers JR. Renal redox stress and remodeling in metabolic syndrome, type 2 diabetes mellitus, and diabetic nephropathy: paying homage to the podocyte. Am J Nephrol. 2005;25:553–569. - PubMed
-
- Stewart JH, McCredie MR, Williams SM, Jager KJ, Trpeski L, McDonald SP. Trends in incidence of treated end-stage renal disease, overall and by primary renal disease, in persons aged 20–64 years in Europe, Canada and the Asia-Pacific region, 1998–2002. Nephrology (Carlton) 2007;12:520–527. - PubMed
-
- Penno G, Miccoli R, Pucci L, Del Prato S. The metabolic syndrome. Beyond the insulin resistance syndrome. Pharmacol Res. 2006;53:457–468. - PubMed
Publication types
MeSH terms
Substances
Grants and funding
LinkOut - more resources
Full Text Sources
Medical
Molecular Biology Databases
Miscellaneous
