

PubChem3D: Biologically relevant 3-D similarity
- PMID: 21781288
- PMCID: PMC3223603
- DOI: 10.1186/1758-2946-3-26
PubChem3D: Biologically relevant 3-D similarity
Abstract
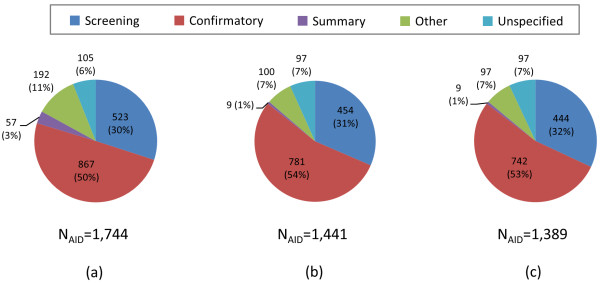
Background: The use of 3-D similarity techniques in the analysis of biological data and virtual screening is pervasive, but what is a biologically meaningful 3-D similarity value? Can one find statistically significant separation between "active/active" and "active/inactive" spaces? These questions are explored using 734,486 biologically tested chemical structures, 1,389 biological assay data sets, and six different 3-D similarity types utilized by PubChem analysis tools.
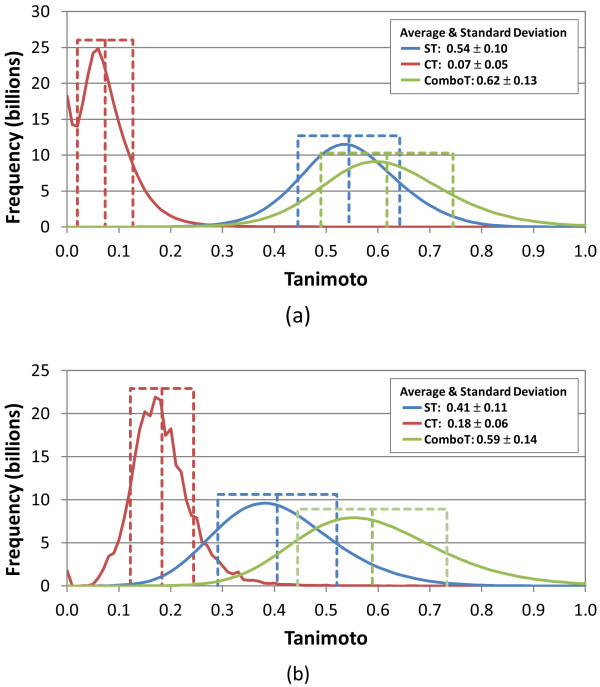
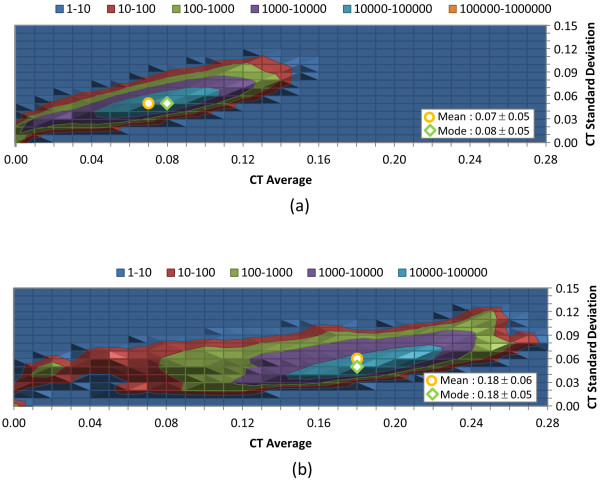
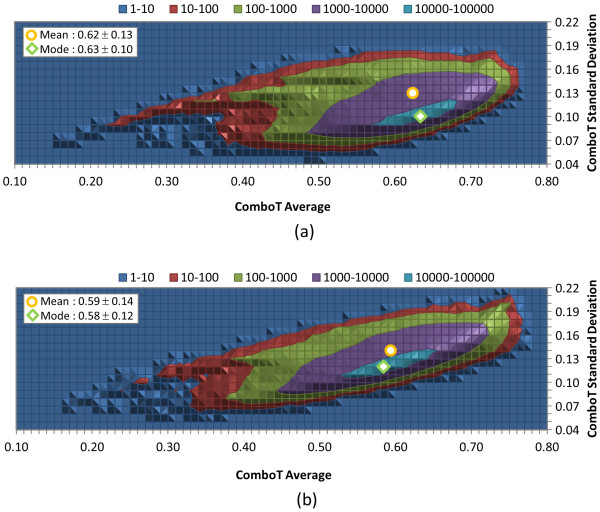
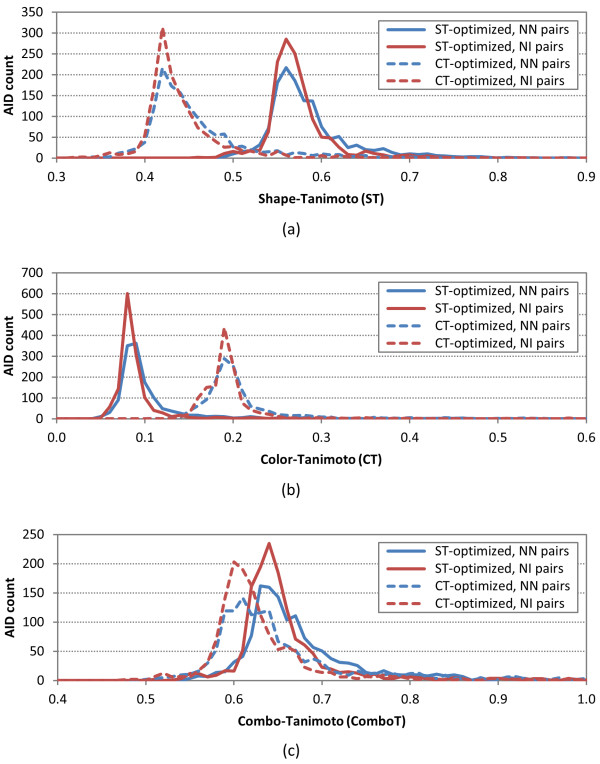
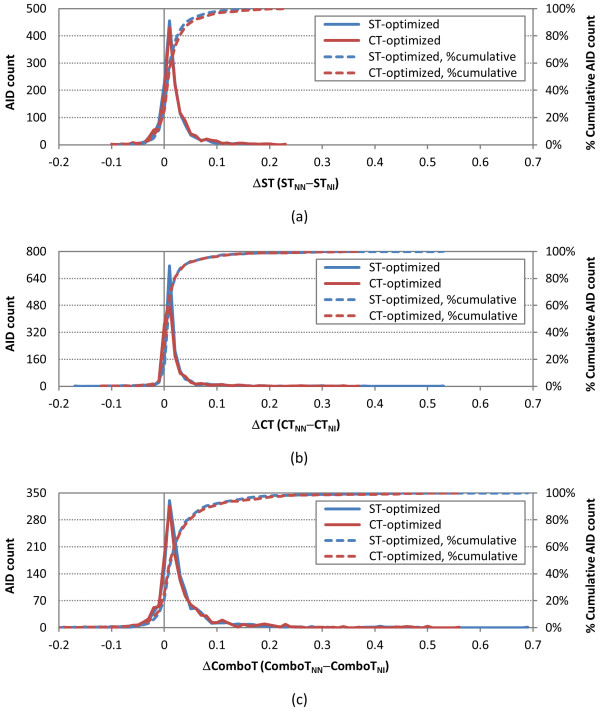
Results: The similarity value distributions of 269.7 billion unique conformer pairs from 734,486 biologically tested compounds (all-against-all) from PubChem were utilized to help work towards an answer to the question: what is a biologically meaningful 3-D similarity score? The average and standard deviation for the six similarity measures STST-opt, CTST-opt, ComboTST-opt, STCT-opt, CTCT-opt, and ComboTCT-opt were 0.54 ± 0.10, 0.07 ± 0.05, 0.62 ± 0.13, 0.41 ± 0.11, 0.18 ± 0.06, and 0.59 ± 0.14, respectively. Considering that this random distribution of biologically tested compounds was constructed using a single theoretical conformer per compound (the "default" conformer provided by PubChem), further study may be necessary using multiple diverse conformers per compound; however, given the breadth of the compound set, the single conformer per compound results may still apply to the case of multi-conformer per compound 3-D similarity value distributions. As such, this work is a critical step, covering a very wide corpus of chemical structures and biological assays, creating a statistical framework to build upon.The second part of this study explored the question of whether it was possible to realize a statistically meaningful 3-D similarity value separation between reputed biological assay "inactives" and "actives". Using the terminology of noninactive-noninactive (NN) pairs and the noninactive-inactive (NI) pairs to represent comparison of the "active/active" and "active/inactive" spaces, respectively, each of the 1,389 biological assays was examined by their 3-D similarity score differences between the NN and NI pairs and analyzed across all assays and by assay category types. While a consistent trend of separation was observed, this result was not statistically unambiguous after considering the respective standard deviations. While not all "actives" in a biological assay are amenable to this type of analysis, e.g., due to different mechanisms of action or binding configurations, the ambiguous separation may also be due to employing a single conformer per compound in this study. With that said, there were a subset of biological assays where a clear separation between the NN and NI pairs found. In addition, use of combo Tanimoto (ComboT) alone, independent of superposition optimization type, appears to be the most efficient 3-D score type in identifying these cases.
Conclusion: This study provides a statistical guideline for analyzing biological assay data in terms of 3-D similarity and PubChem structure-activity analysis tools. When using a single conformer per compound, a relatively small number of assays appear to be able to separate "active/active" space from "active/inactive" space.
Figures
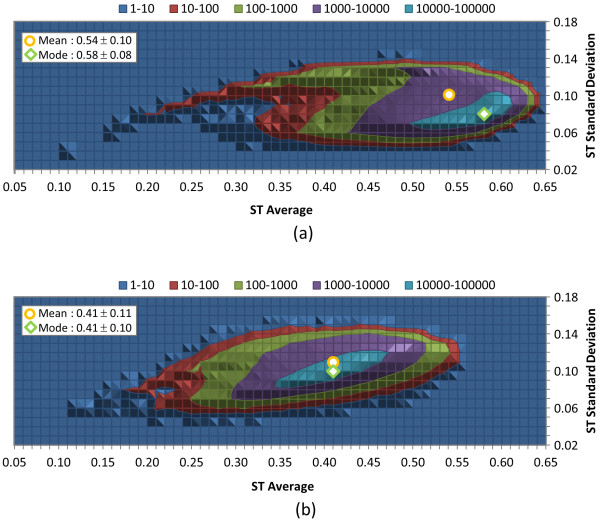
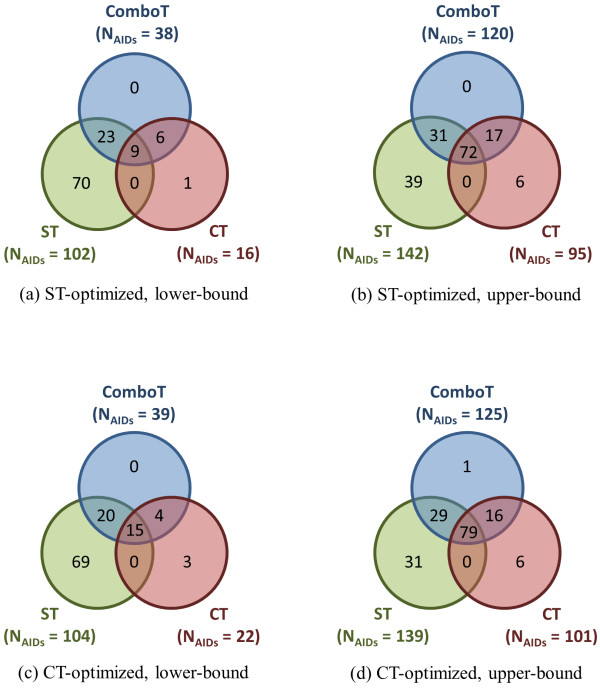
 , where "lower-bound" corresponds to μ - σ and "upper-bound" corresponds to μ + σ.
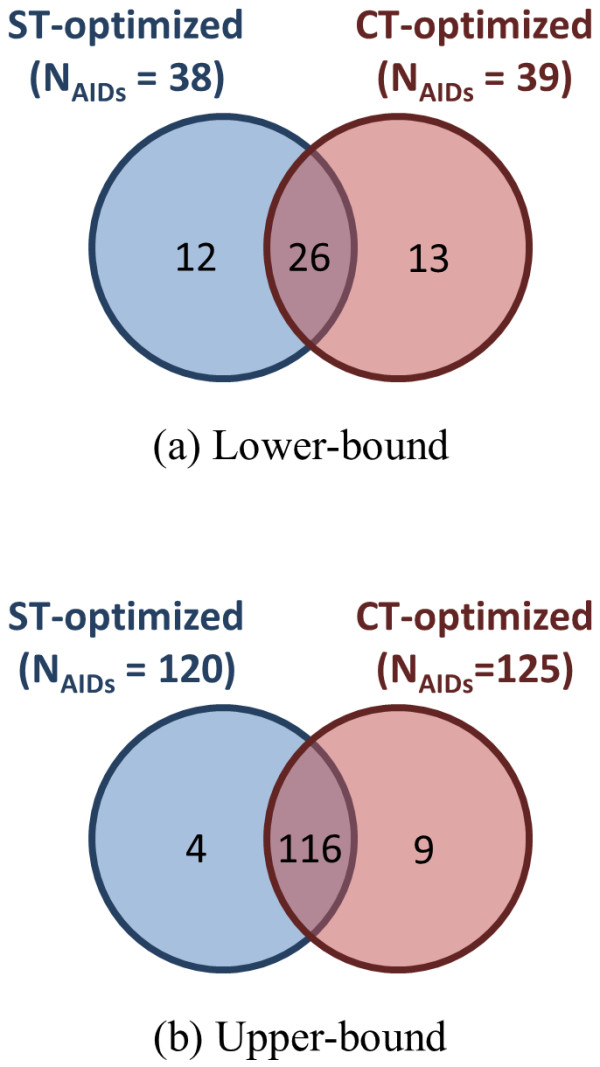
 , where "lower-bound" corresponds to μ - σ and "upper-bound" corresponds to μ + σ. Upper-bound outliers tend to be shared by both superposition optimization types, while lower-bound outliers are less shared.
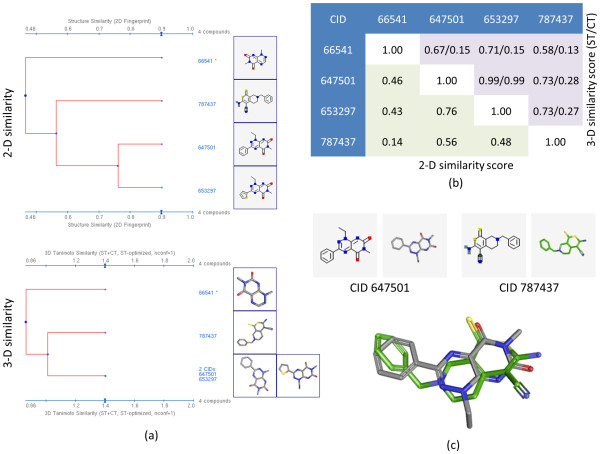
 3-D similarities of 0.45 (see Table 5), the four active compounds from AID 672: (a) shows 2-D and 3-D similarity dendrograms generated using the PubChem Structure Clustering tool; (b) shows the respective 2-D similarity values (lower triangle) and 3-D similarity values (upper triangle); and (c) shows a representative alignment showing how CID 647501 is 3-D similar to CID 787437 (ST/CT 0.73/0.28), despite low 2-D similarity (0.56).
References
-
- Diller DJ. The synergy between combinatorial chemistry and high-throughput screening. Curr Opin Drug Discov Dev. 2008;11:346–355. - PubMed
LinkOut - more resources
Full Text Sources
Research Materials
