. 2011 Jul 22:4:257.
doi: 10.1186/1756-0500-4-257.

PromBase: a web resource for various genomic features and predicted promoters in prokaryotic genomes

Affiliations

PromBase: a web resource for various genomic features and predicted promoters in prokaryotic genomes

Vetriselvi Rangannan et al. BMC Res Notes. .

Abstract

Background: As more and more genomes are being sequenced, an overview of their genomic features and annotation of their functional elements, which control the expression of each gene or transcription unit of the genome, is a fundamental challenge in genomics and bioinformatics.

Findings: Relative stability of DNA sequence has been used to predict promoter regions in 913 microbial genomic sequences with GC-content ranging from 16.6% to 74.9%. Irrespective of the genome GC-content the relative stability based promoter prediction method has already been proven to be robust in terms of recall and precision. The predicted promoter regions for the 913 microbial genomes have been accumulated in a database called PromBase. Promoter search can be carried out in PromBase either by specifying the gene name or the genomic position. Each predicted promoter region has been assigned to a reliability class (low, medium, high, very high and highest) based on the difference between its average free energy and the downstream region. The recall and precision values for each class are shown graphically in PromBase. In addition, PromBase provides detailed information about base composition, CDS and CG/TA skews for each genome and various DNA sequence dependent structural properties (average free energy, curvature and bendability) in the vicinity of all annotated translation start sites (TLS).

Conclusion: PromBase is a database, which contains predicted promoter regions and detailed analysis of various genomic features for 913 microbial genomes. PromBase can serve as a valuable resource for comparative genomics study and help the experimentalist to rapidly access detailed information on various genomic features and putative promoter regions in any given genome. This database is freely accessible for academic and non- academic users via the worldwide web http://nucleix.mbu.iisc.ernet.in/prombase/.


Figures
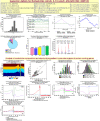
Figure 1
Figure 1
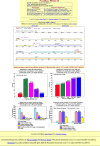
The results provided on the web page in PromBase from analysis of genomic features for each bacterial genome. In this figure, E. coli K12 MG1655 strain has been chosen as a specific example. The table at top provides the statistics of the genome. Analysis results for each feature as listed in Database content have been illustrated using a plot or histogram.
Figure 2
Figure 2
PromBase web interface. Rectangular box indicates a web page. Block arrows indicate the page transition caused by an action. Callouts give a simple explanation for information content availability at each page. Round headed line shows interlock between the information availability.
Figure 3
Figure 3
PromBase result page for prediction and analysis of promoter regions in E. coli K12 MG1655 strain. Table at top provides the statistics for the whole genome promoter prediction for E. coli. Genome browser view is shown for a position specific search centered on 72 Kbp of the genome with a flanking region of 2 Kbp. Histogram below illustrates the analysis of the prediction results in terms of %recall and %precision, as well as prediction distribution and density within various intergenic and coding regions.
Figure 4
Figure 4
General feature distribution in 913 microbial genomes. The statistics for each of the features is given alongside the histograms. A) genome size B) %GC content C) Total number of genes D) Gene density E) %coding region (including protein and RNA) F) Number of overlapping genes.
Figure 5
Figure 5
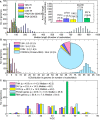
Analysis of TAN, DIV, CON intergenic regions and CODING regions. A) Length distribution of different regions in bacterial genomes. Inner bar chart shows the average length of different regions in all 913 bacterial genomes. The standard deviation for length of different regions is indicated as error bar (values are given in brackets). B) Percentage distribution of different intergenic and coding regions in bacterial genomes. Inner pie chart gives the overall average distribution in all bacterial genomes. The average value and the standard deviations (in bracket) are shown with the legend. RNA gene distribution is very small (0.73%) as compared to others, hence it is not shown in the figure. C) GC-content distribution in different regions of bacterial genomes. The overall mean, standard deviation and median values are also given.

References

    1. Lagesen K, Ussery DW, Wassenaar TM. Genome Update: The Thousandth Genome-A Cautionary Tale. Microbiology. 2010;156:603–608. doi: 10.1099/mic.0.038257-0. - DOI - PubMed
    1. Hershberg R, Altuvia S, Margalit H. A survey of small RNA-encoding genes in Escherichia coli. Nucleic Acids Res. 2003;31:1813–1820. doi: 10.1093/nar/gkg297. - DOI - PMC - PubMed
    1. Jacques PE, Gervais AL, Cantin M, Lucier JF, Dallaire G, Drouin G, Gaudreau L, Goulet J, Brzezinski R. MtbRegList, a database dedicated to the analysis of transcriptional regulation in Mycobacterium tuberculosis. Bioinformatics. 2005;21:2563–2565. doi: 10.1093/bioinformatics/bti321. - DOI - PubMed
    1. Keseler IM, Collado-Vides J, Gama-Castro S, Ingraham J, Paley S, Paulsen IT, Peralta-Gil M, Karp PD. EcoCyc: a comprehensive database resource for Escherichia coli. Nucleic Acids Res. 2005;33:D334–337. - PMC - PubMed
    1. Makita Y, Nakao M, Ogasawara N, Nakai K. DBTBS: database of transcriptional regulation in Bacillus subtilis and its contribution to comparative genomics. Nucleic Acids Res. 2004;32:D75–77. doi: 10.1093/nar/gkh074. - DOI - PMC - PubMed