. 2012 Feb;56(2):433-40.
doi: 10.1016/j.jhep.2011.05.030. Epub 2011 Jul 23.

High fructose feeding induces copper deficiency in Sprague-Dawley rats: a novel mechanism for obesity related fatty liver

Affiliations

High fructose feeding induces copper deficiency in Sprague-Dawley rats: a novel mechanism for obesity related fatty liver

Ming Song et al. J Hepatol. 2012 Feb.

Abstract

Background & aims: Dietary copper deficiency is associated with a variety of manifestations of the metabolic syndrome, including hyperlipidemia and fatty liver. Fructose feeding has been reported to exacerbate complications of copper deficiency. In this study, we investigated whether copper deficiency plays a role in fructose-induced fatty liver and explored the potential underlying mechanism(s).

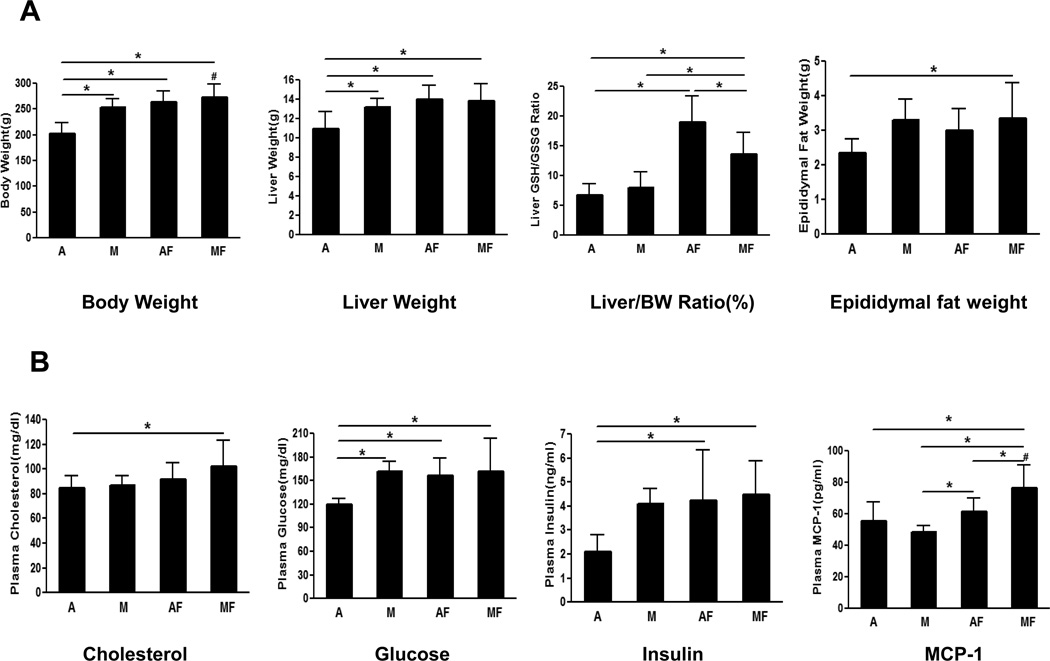
Methods: Male weanling Sprague-Dawley rats were fed either an adequate copper or a marginally copper deficient diet for 4 weeks. Deionized water or deionized water containing 30% fructose (w/v) was also given ad lib. Copper and iron status, hepatic injury and steatosis, and duodenum copper transporter-1 (Ctr-1) were assessed.

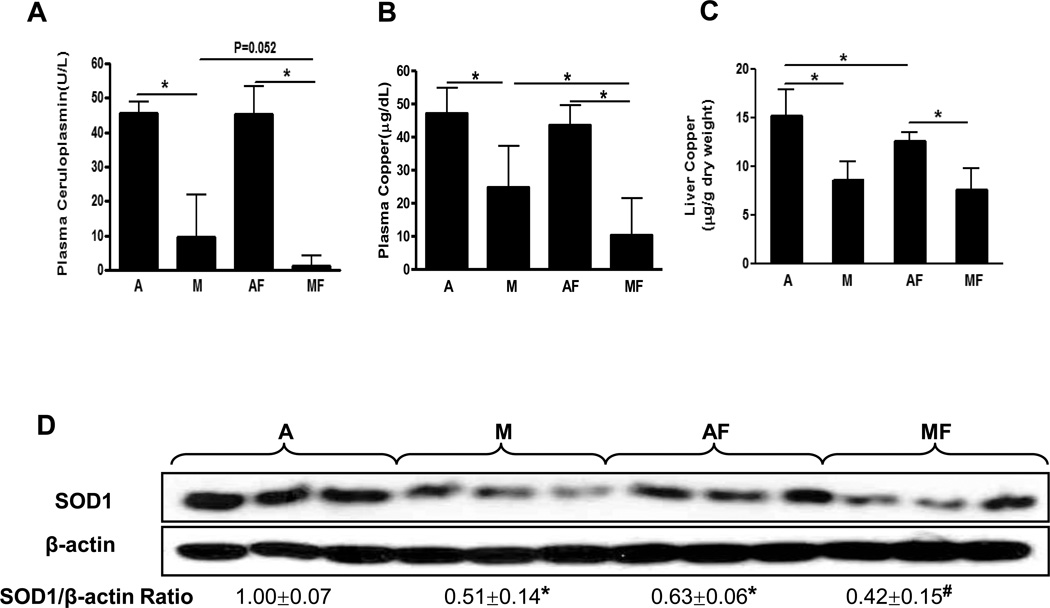
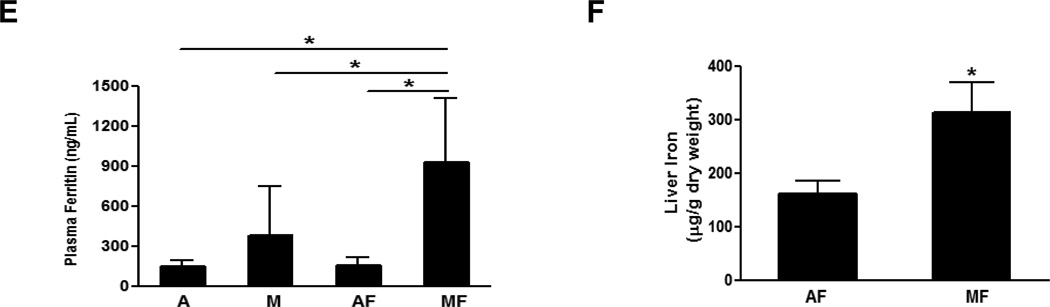
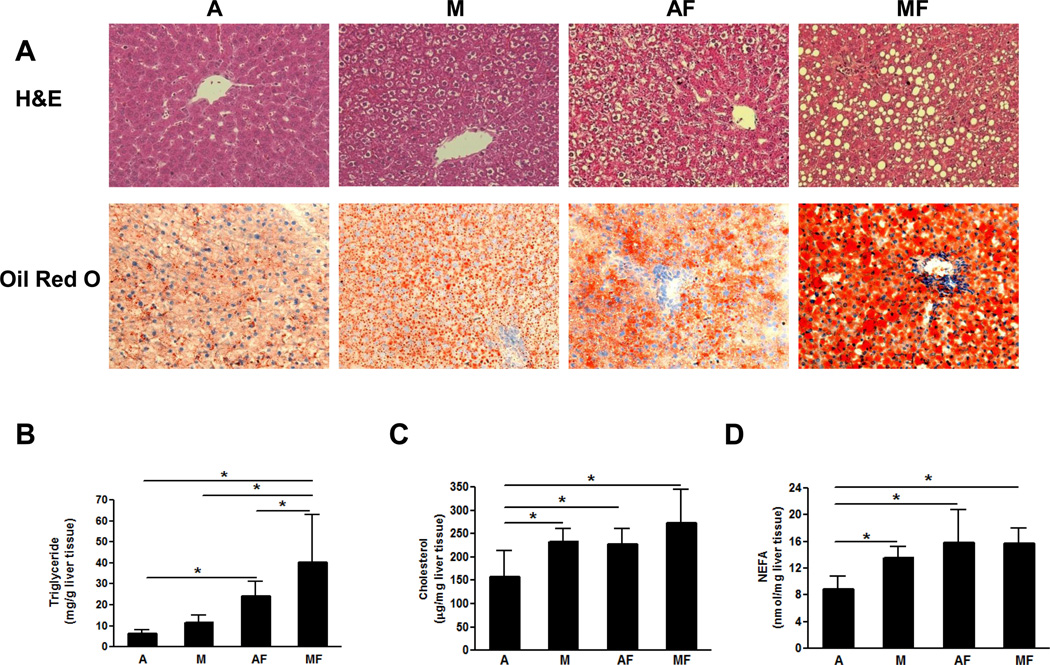
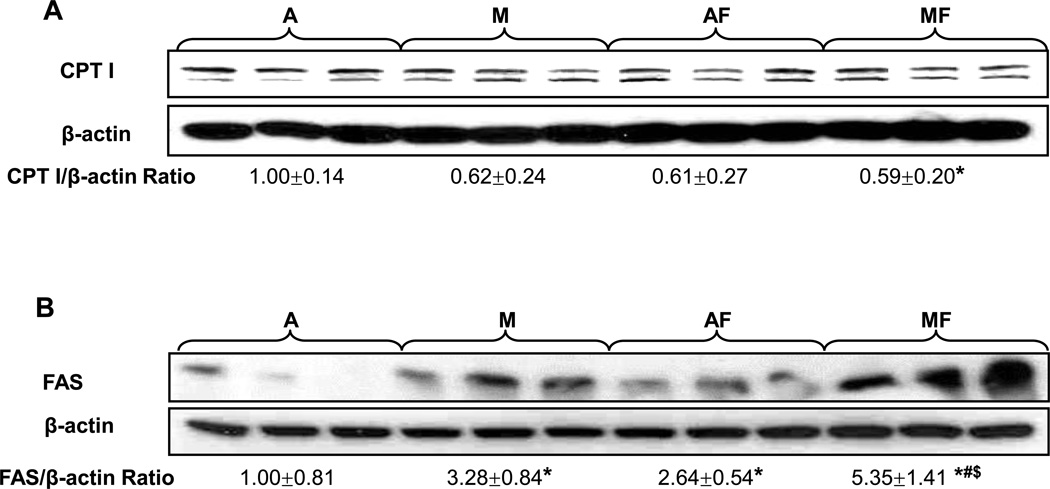
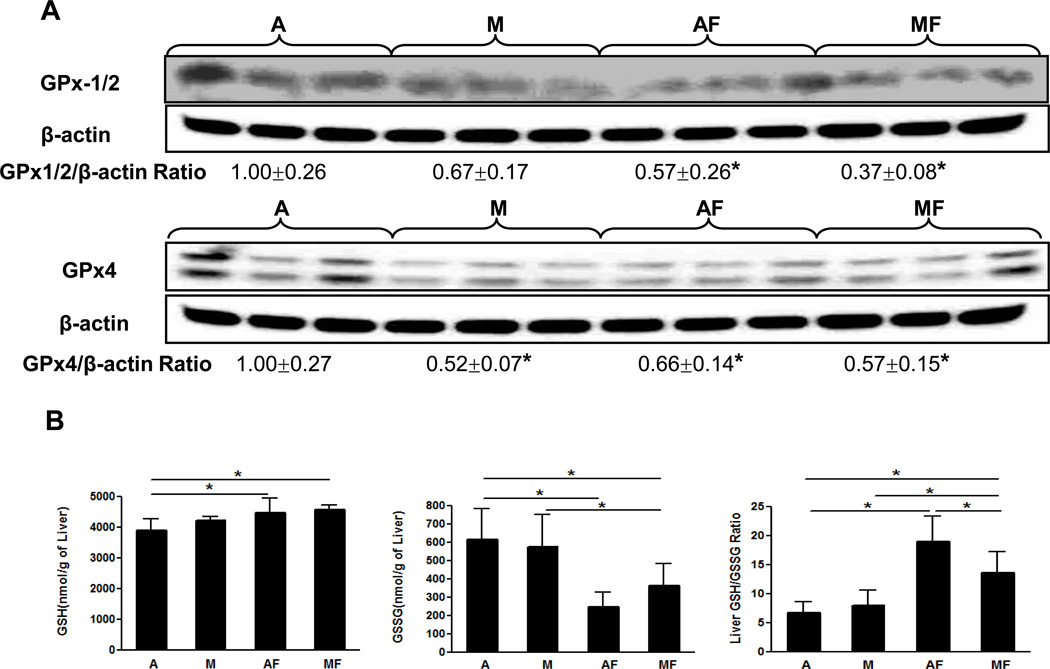
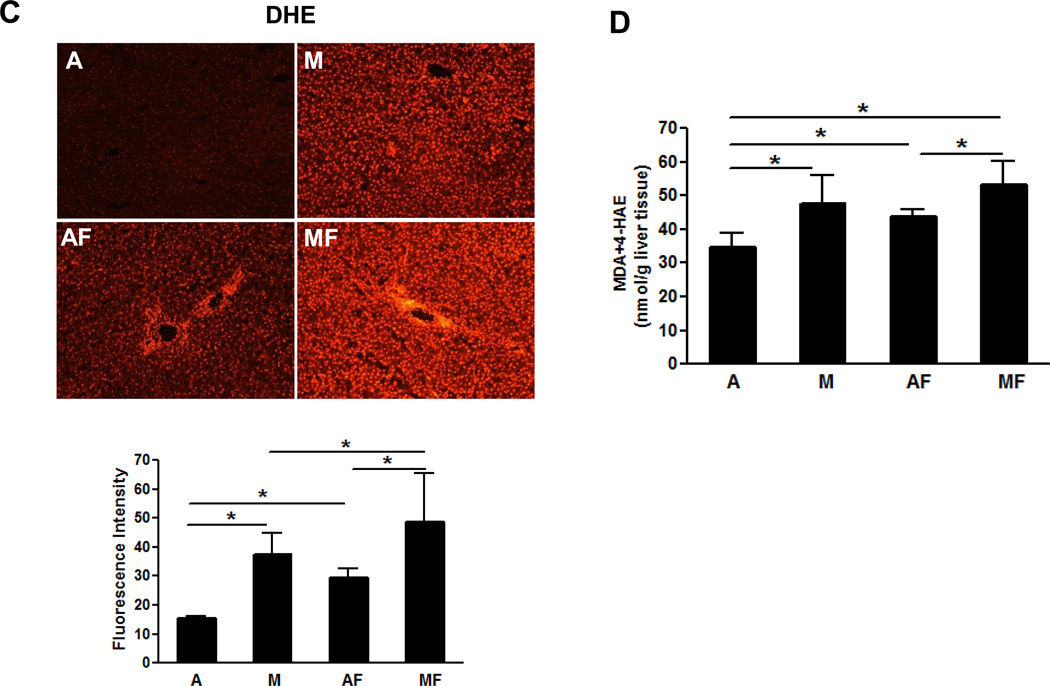
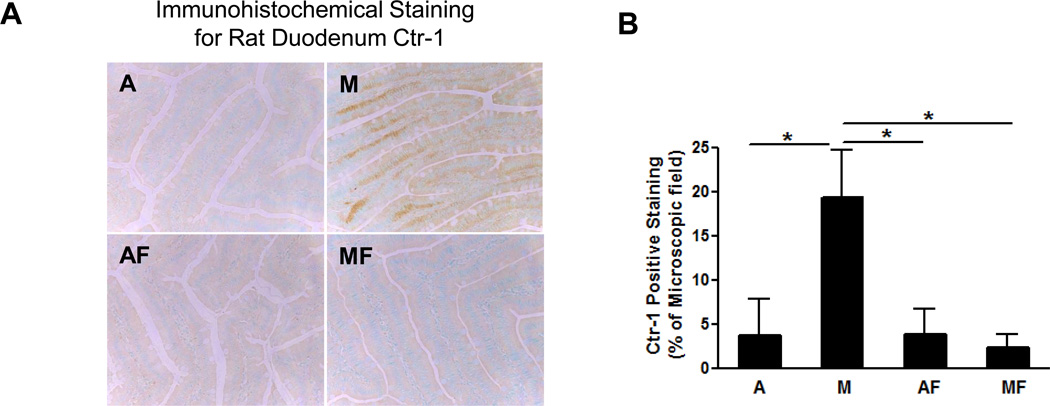
Results: Fructose feeding further impaired copper status and led to iron overload. Liver injury and fat accumulation were significantly induced in marginal copper deficient rats exposed to fructose as evidenced by robustly increased plasma aspartate aminotransferase (AST) and hepatic triglyceride. Hepatic carnitine palmitoyl-CoA transferase I (CPT I) expression was significantly inhibited, whereas hepatic fatty acid synthase (FAS) was markedly up-regulated in marginal copper deficient rats fed with fructose. Hepatic antioxidant defense system was suppressed and lipid peroxidation was increased by marginal copper deficiency and fructose feeding. Moreover, duodenum Ctr-1 expression was significantly increased by marginal copper deficiency, whereas this increase was abrogated by fructose feeding.

Conclusions: Our data suggest that high fructose-induced nonalcoholic fatty liver disease (NAFLD) may be due, in part, to inadequate dietary copper. Impaired duodenum Ctr-1 expression seen in fructose feeding may lead to decreased copper absorption, and subsequent copper deficiency.


Conflict of interest statement

Financial disclosure: The authors have no financial and commercial conflicts of interest.

Figures

Fig. 1
Fig. 1. Characterization of marginal copper deficiency and fructose feedin
(A) Body Weight (BW), liver Weight, liver/BW Ratio (%), Epididymal fat weight. (B) Plasma cholesterol, glucose, insulin, MCP-1. Data represent means ± SD (n=5–9). *p<0.05. #, interaction between copper and fructose is significant (p<0.05). A, adequate copper diet; M, marginal copper deficient diet; AF, adequate copper diet+30% fructose drinking; MF, marginal copper deficient diet+30% fructose drinking.
Fig. 2
Fig. 2. Effect of fructose feeding on copper and iron status
(A) Plasma ceruloplasmin. (B) Plasma copper. (C) Liver copper. Data represent means ± SD (n=5–9). *p<0.05. (D) Hepatic SOD1 expression was determined by Western Blots. Optical density of band was quantified by ImageJ software. The ratio to β-actin was calculated by assigning the value from adequate copper diet controls as one. Data represent means ± SD (n=3). *p<0.05 versus A; #p<0.05 versus AF. (E) Plasma ferritin. (F) Liver iron. Data represent means ± SD (n=5–9). *p<0.05. A, adequate copper diet; M, marginal copper deficient diet; AF, adequate copper diet+30% fructose drinking; MF, marginal copper deficient diet+30% fructose drinking.
Fig. 3
Fig. 3. Effect of marginal copper deficiency and fructose feeding on liver injury
(A) Plasma ALT and AST level. (B) Representative photomicrographs of TUNEL staining of liver section (400×). Data represent means ± SD (n=5–9). *p<0.05; #, interaction between copper and fructose is significant (p<0.05). A, adequate copper diet; M, marginal copper deficient diet; AF, adequate copper diet+30% fructose drinking; MF, marginal copper deficient diet+30% fructose drinking.
Fig. 4
Fig. 4. Effect of marginal copper deficiency and fructose feeding on the hepatic lipid accumulation
(A) Representative photomicrographs of the H&E and Oil Red O staining of liver section (200×). (B) Hepatic triglyceride. (C) Hepatic cholesterol. (D) Hepatic NEFA. Data represent means ± SD (n=5–9). *p<0.05. A, adequate copper diet; M, marginal copper deficient diet; AF, adequate copper diet+30% fructose drinking; MF, marginal copper deficient diet+30% fructose drinking.
Fig. 5
Fig. 5. Effect of marginal copper deficiency and fructose feeding on the expression of hepatic lipid metabolic enzymes
(A) Hepatic CPT I and (B) FAS expression was determined by Western Blots. There are two bands in CPT I, with the top one being the liver isoform. Optical density of band was quantified by ImageJ software. The ratio to β-actin was calculated by assigning the value from adequate copper diet controls as one. Data represent means ± SD (n=3). *p<0.05 versus A; #p<0.05 versus M; $p<0.05 versus AF. A, adequate copper diet; M, marginal copper deficient diet; AF, adequate copper diet+30% fructose drinking; MF, marginal copper deficient diet+30% fructose drinking.
Fig. 6
Fig. 6. Effect of marginal copper deficiency and fructose feeding on hepatic antioxidant defense system
(A) Hepatic GPx1/2 and GPx4 expression were determined by Western Blots. Optical density of band was quantified by ImageJ software. The ratio to β-actin was calculated by assigning the value from adequate copper diet controls as one. Data represent means ± SD (n=3). *p<0.05 versus A. (B) Hepatic GSH, GSSG and GSH/GSSG ratio measured by HPLC. (C) Representative photomicrographs of the dihydroethidium staining of liver section (100×) and quantification (bottom). Dihydroethidium is oxidized by superoxide to yield red fluorescence that binds to the nucleic acids, staining the nucleus a bright fluorescent red. The bottom figure showed the mean of red fluorescence density quantified by Image J. Data represent means ± SD (n=4–9). *p<0.05. (D) Lipid peroxidation was assessed by MDA+4-HAE in liver homogenate. Data represent means ± SD (n=5–9). *p<0.05. A, adequate copper diet; M, marginal copper deficient diet; AF, adequate copper diet+30% fructose drinking; MF, marginal copper deficient diet+30% fructose drinking.
Fig. 7
Fig. 7. Effect of marginal copper deficiency and fructose feeding on duodenal epithelium Ctr-1
(A) Representative photomicrographs of immunohistochemical staining for rat duodenum Ctr-1 (200×). (B) Image quantification of Ctr-1 positive staining. Data represent means ± SD (n=5–6). *p<0.05. A, adequate copper diet; M, marginal copper deficient diet; AF, adequate copper diet+30% fructose drinking; MF, marginal copper deficient diet+30% fructose drinking.

References

    1. Hallfrisch J. Metabolic effects of dietary fructose. FASEB J. 1990;4:2652–2660. - PubMed
    1. Spruss A, Bergheim I. Dietary fructose and intestinal barrier: potential risk factor in the pathogenesis of nonalcoholic fatty liver disease. J Nutr Biochem. 2009;20:657–662. - PubMed
    1. Assy N, Nasser G, Kamayse I, Nseir W, Beniashvili Z, Djibre A, et al. Soft drink consumption linked with fatty liver in the absence of traditional risk factors. Can J Gastroenterol. 2008;22:811–816. - PMC - PubMed
    1. Ouyang X, Cirillo P, Sautin Y, McCall S, Bruchette JL, Diehl AM, et al. Fructose consumption as a risk factor for non-alcoholic fatty liver disease. J Hepatol. 2008;48:993–999. - PMC - PubMed
    1. Holden JM, Wolf WR, Mertz W. Zinc and copper in self-selected diets. J Am Diet Assoc. 1979;75:23–28. - PubMed

Publication types

MeSH terms