Randomized Controlled Trial
. 2011 Jul;7(4):402-11.
doi: 10.1016/j.jalz.2010.12.014.

Extended results of the Alzheimer's disease anti-inflammatory prevention trial

Affiliations
Randomized Controlled Trial

Extended results of the Alzheimer's disease anti-inflammatory prevention trial

John C Breitner et al. Alzheimers Dement. 2011 Jul.

Abstract

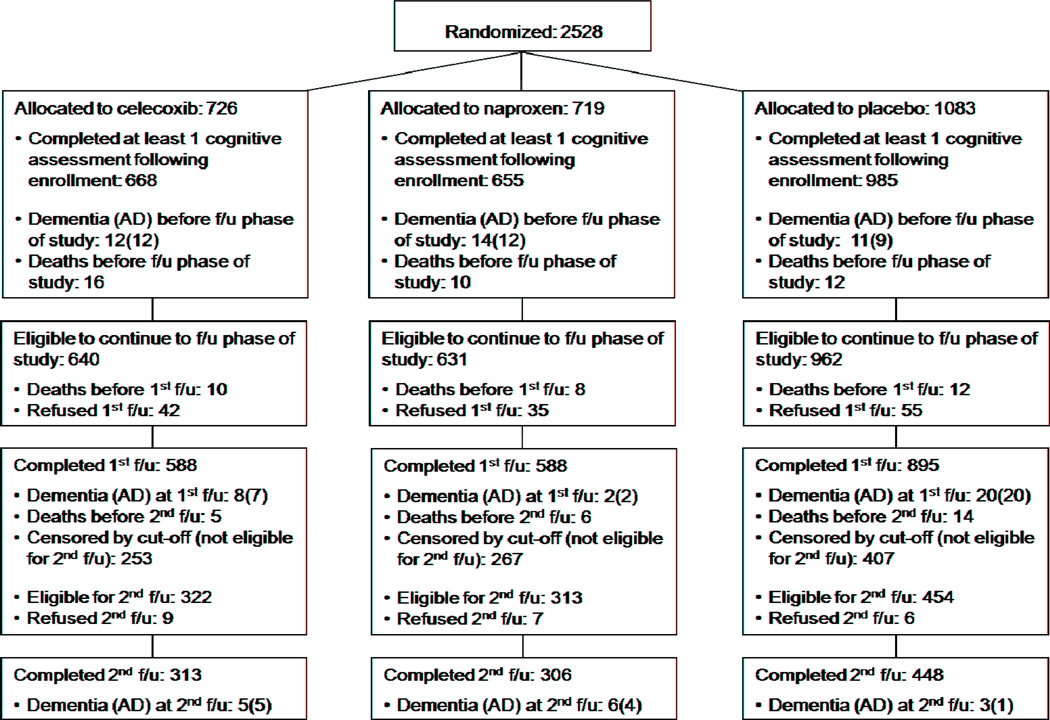
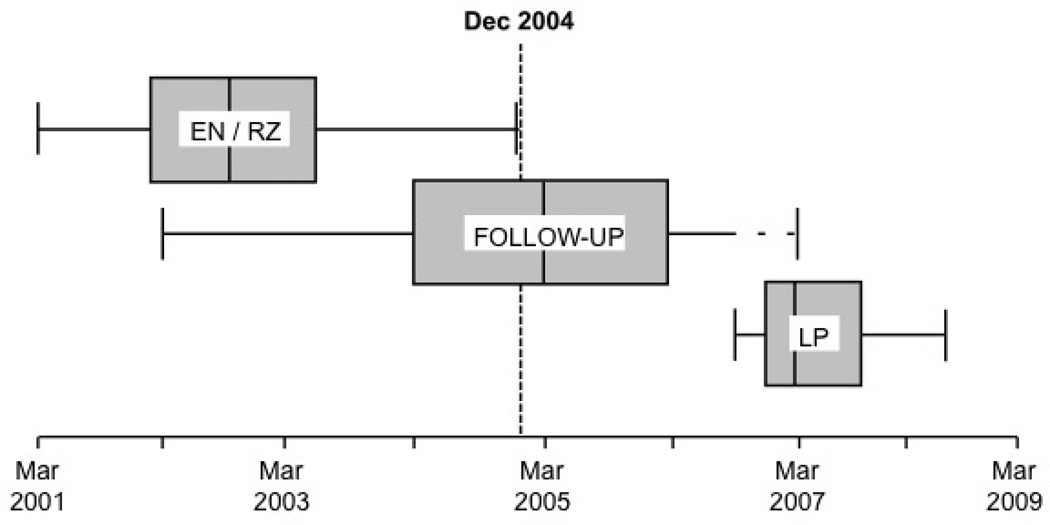
Background: Epidemiologic evidence suggests that nonsteroidal anti-inflammatory drugs (NSAIDs) delay onset of Alzheimer's dementia (AD), but randomized trials show no benefit from NSAIDs in patients with symptomatic AD. The Alzheimer's Disease Anti-inflammatory Prevention Trial (ADAPT) randomized 2,528 elderly persons to naproxen or celecoxib versus placebo for 2 years (standard deviation = 11 months) before treatments were terminated. During the treatment interval, 32 cases of AD revealed increased rates in both NSAID-assigned groups.

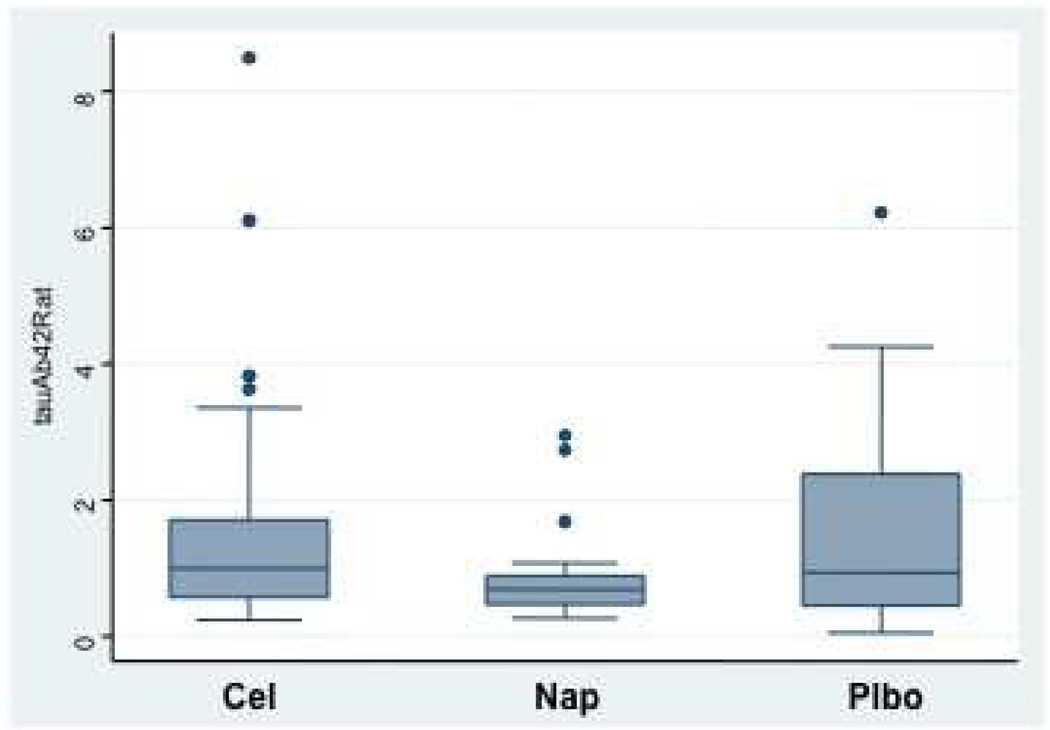
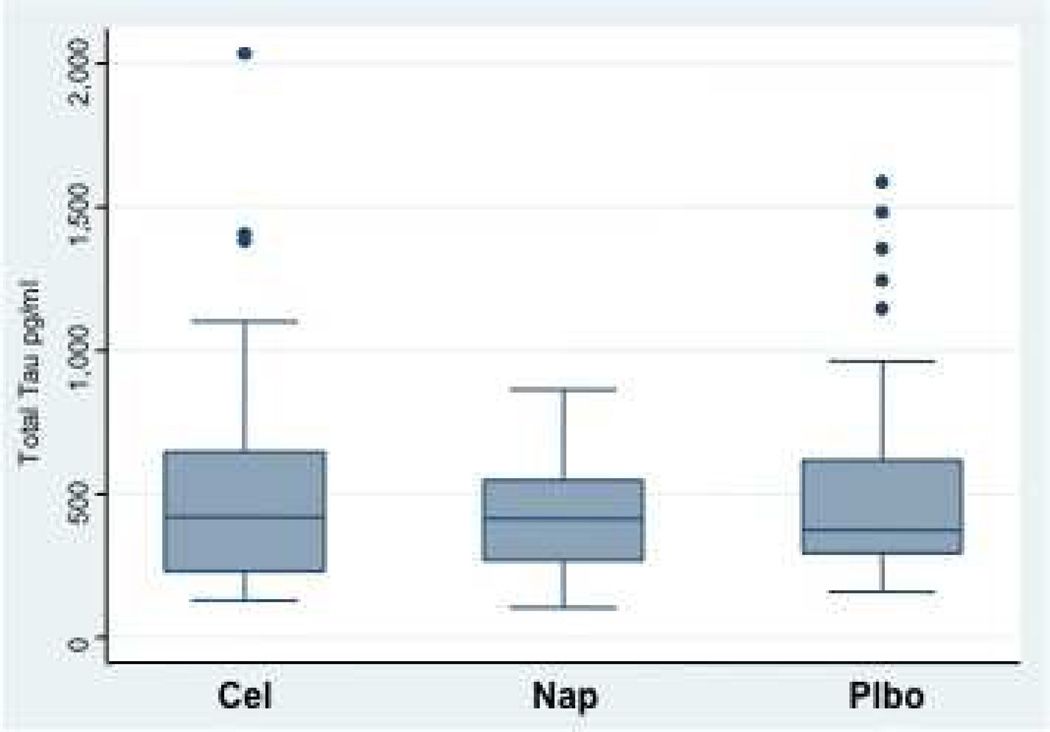
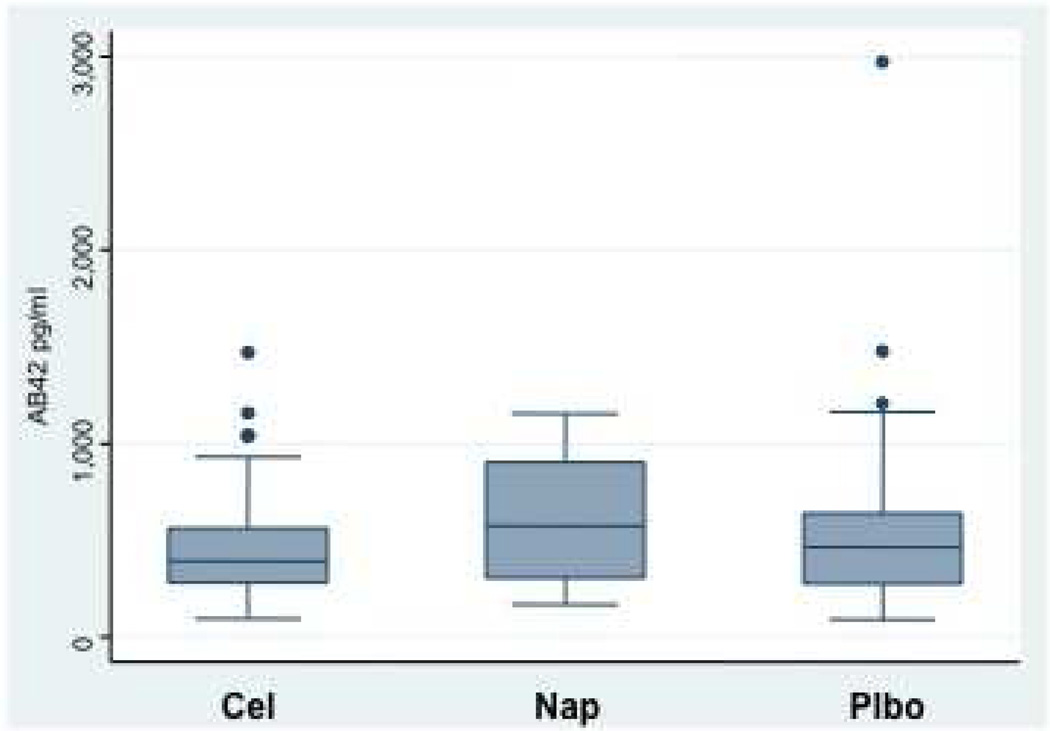
Methods: We continued the double-masked ADAPT protocol for 2 additional years to investigate incidence of AD (primary outcome). We then collected cerebrospinal fluid (CSF) from 117 volunteer participants to assess their ratio of CSF tau to Aβ(1-42.)

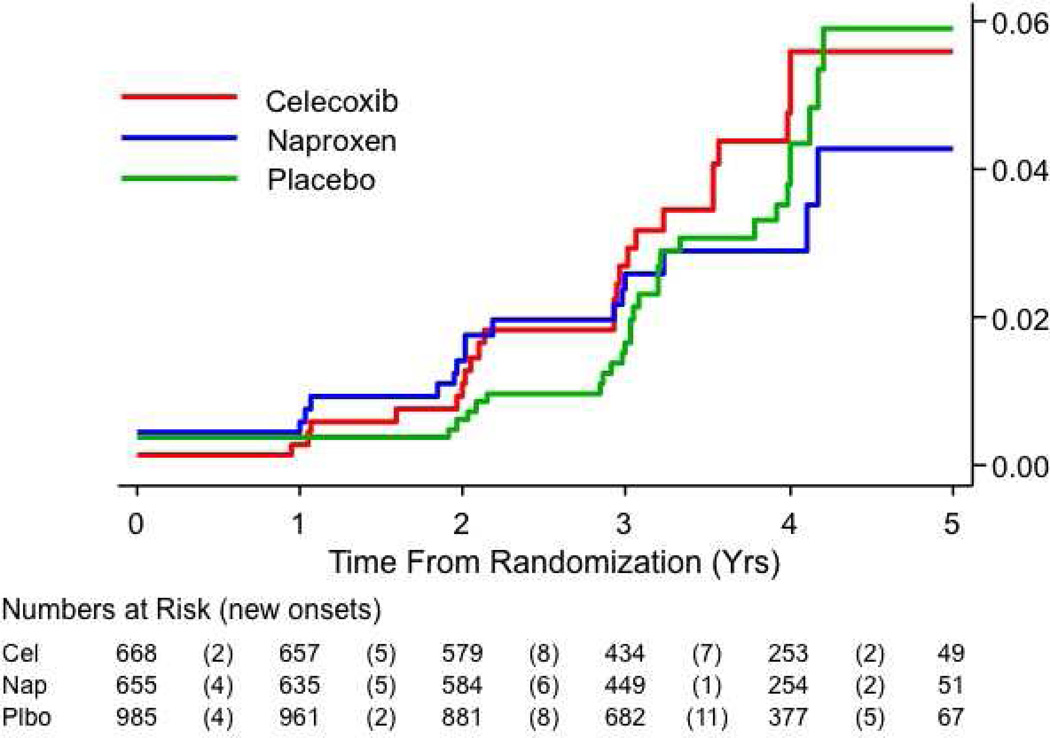
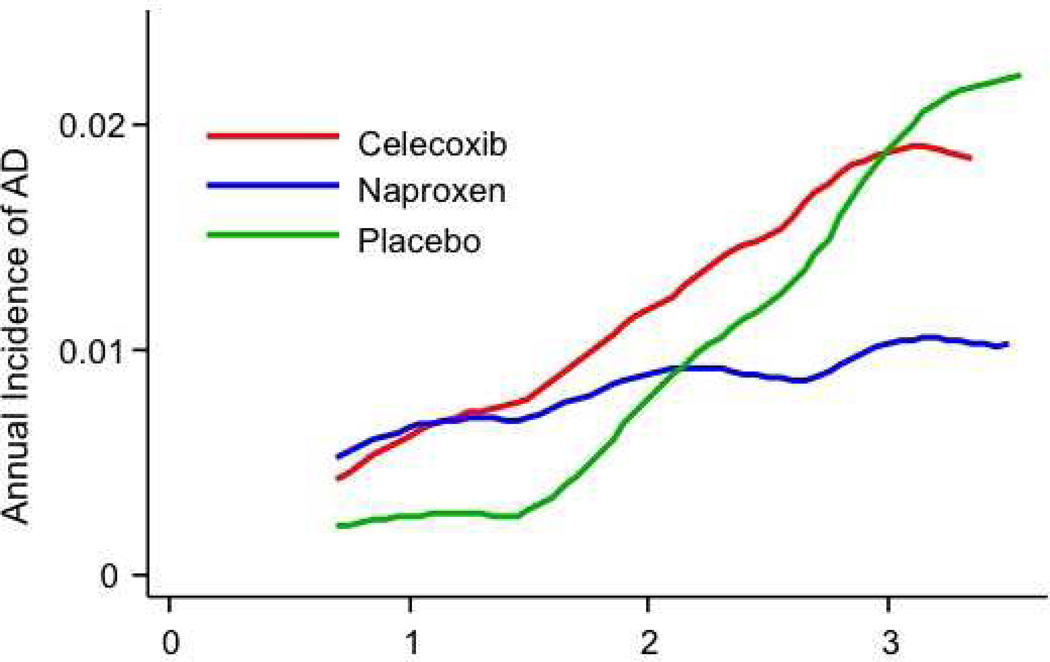
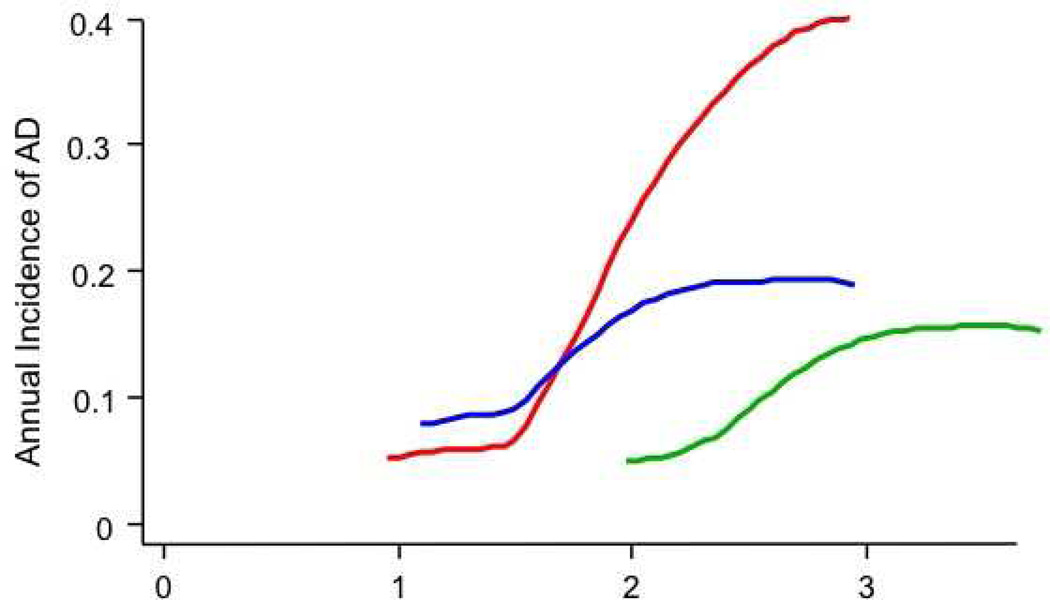
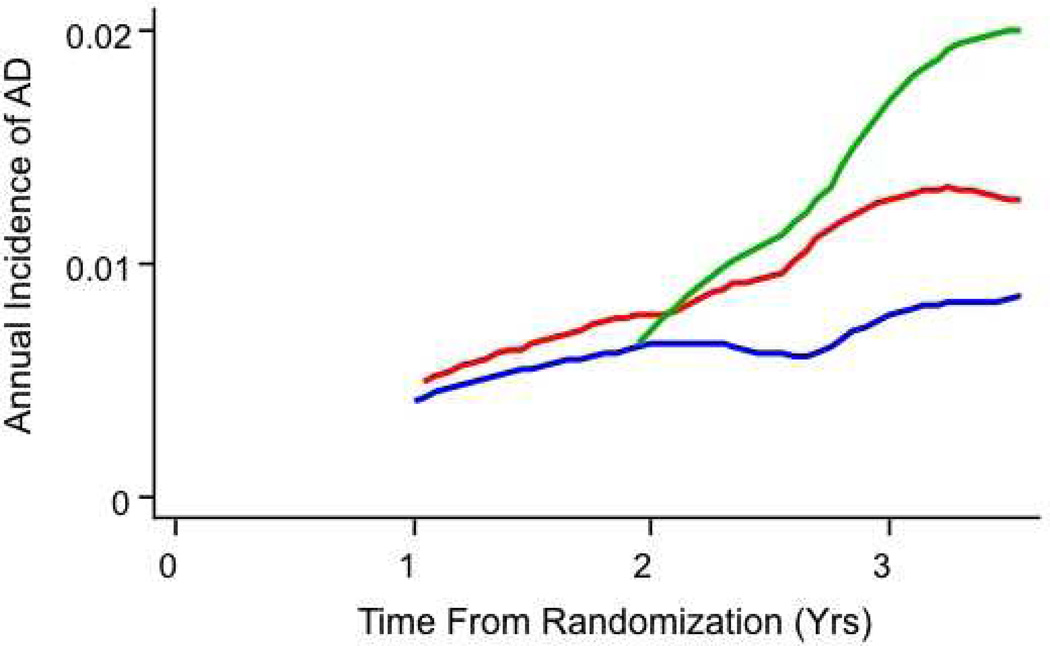
Results: Including 40 new events observed during follow-up of 2,071 randomized individuals (92% of participants at treatment cessation), there were 72 AD cases. Overall, NSAID-related harm was no longer evident, but secondary analyses showed that increased risk remained notable in the first 2.5 years of observations, especially in 54 persons enrolled with cognitive impairment--no dementia (CIND). These same analyses showed later reduction in AD incidence among asymptomatic enrollees who were given naproxen. CSF biomarker assays suggested that the latter result reflected reduced Alzheimer-type neurodegeneration.

Conclusions: These data suggest a revision of the original ADAPT hypothesis that NSAIDs reduce AD risk, as follows: NSAIDs have an adverse effect in later stages of AD pathogenesis, whereas asymptomatic individuals treated with conventional NSAIDs such as naproxen experience reduced AD incidence, but only after 2 to 3 years. Thus, treatment effects differ at various stages of disease. This hypothesis is consistent with data from both trials and epidemiological studies.


Figures

Figure 1
Figure 1
The figure shows numbers originally randomized to the three treatment groups as well as numbers eligible to continue to follow-up observation after the end of the treatment interval. The latter include subjects whose first annual follow-up visit occurred during the follow-up period, and therefore differ from the final numbers remaining in the CONSORT-style figure of Reference .
Figure 2
Figure 2
A, Box-plots showing periods of enrollment and randomization (EN-RZ), follow-up evaluations (FU), and lumbar punctures (LP). Enrollment began in March 2001. LPs commenced in September 2006 in participants for whom clinical follow-up was complete (dashed line). B, Estimated cumulative incidence of AD (primary analysis). Only 3 new cases appeared among 447 naproxen-assigned individuals remaining after 3 years. The lines’ non-zero origins reflect inclusion in this analysis of 8 prevalent dementia cases.
Figure 2
Figure 2
A, Box-plots showing periods of enrollment and randomization (EN-RZ), follow-up evaluations (FU), and lumbar punctures (LP). Enrollment began in March 2001. LPs commenced in September 2006 in participants for whom clinical follow-up was complete (dashed line). B, Estimated cumulative incidence of AD (primary analysis). Only 3 new cases appeared among 447 naproxen-assigned individuals remaining after 3 years. The lines’ non-zero origins reflect inclusion in this analysis of 8 prevalent dementia cases.
Figure 3
Figure 3
A, Estimated decimal annual incidence for the full cohort (primary analysis). The smoothing program could not accommodate the sparse data from the final year of observations. B, Annual incidence of AD among 54 participants with CIND at baseline. Note the different scale for the ordinate vs. 3A. The groups assigned to NSAIDs show acceleration of dementia onset by approximately one year, as compared to those who received placebo. The extreme ordinate values for the later observations among celecoxib-assigned participants should probably be ignored. C, Similar to 3A, but after exclusion of 8 enrollees with AD and 54 with CIND at baseline. An early excess of dementia in both NSAID-assigned groups is still evident, but no participants given placebo developed dementia for 22 months following randomization. New cases of AD increased rapidly thereafter in those assigned to placebo or celecoxib, but incidence among naproxen-assigned participants remained steady at about 0.01/yr.
Figure 3
Figure 3
A, Estimated decimal annual incidence for the full cohort (primary analysis). The smoothing program could not accommodate the sparse data from the final year of observations. B, Annual incidence of AD among 54 participants with CIND at baseline. Note the different scale for the ordinate vs. 3A. The groups assigned to NSAIDs show acceleration of dementia onset by approximately one year, as compared to those who received placebo. The extreme ordinate values for the later observations among celecoxib-assigned participants should probably be ignored. C, Similar to 3A, but after exclusion of 8 enrollees with AD and 54 with CIND at baseline. An early excess of dementia in both NSAID-assigned groups is still evident, but no participants given placebo developed dementia for 22 months following randomization. New cases of AD increased rapidly thereafter in those assigned to placebo or celecoxib, but incidence among naproxen-assigned participants remained steady at about 0.01/yr.
Figure 4
Figure 4
A, Box plots showing distribution of concentrations for total tau (T-tau) for each of the three treatment groups. The “boxes” indicate the range of values between the 25th and 75th percentiles. “Whiskers” indicate the range of values that did not lie outside the interquartile range (IQR, between 25th and 75th percentile) by more than 1.5 X the IQR. Although statistically anomalous, the apparent outliers were probably individuals whose elevated tau concentration was a realistic signal of neurodegenerative illness. All values were considered in the statistical analyses. B, Box plots showing distributions of concentrations for CSF Aβ1–42 by treatment assignment. The meaning of the outlying values here is less clear. All values were again considered in the analyses. C, Box plots showing distribution by treatment assignment for the ratio of T-tau to Aβ1–42 concentrations. The ratios for celecoxib- and placebo-assigned participants were typical of other cognitively normal elderly subjects analyzed in the same laboratory [19]. Ratios for naproxen-assigned participants were reduced, compared to placebo, by 40%.
Figure 4
Figure 4
A, Box plots showing distribution of concentrations for total tau (T-tau) for each of the three treatment groups. The “boxes” indicate the range of values between the 25th and 75th percentiles. “Whiskers” indicate the range of values that did not lie outside the interquartile range (IQR, between 25th and 75th percentile) by more than 1.5 X the IQR. Although statistically anomalous, the apparent outliers were probably individuals whose elevated tau concentration was a realistic signal of neurodegenerative illness. All values were considered in the statistical analyses. B, Box plots showing distributions of concentrations for CSF Aβ1–42 by treatment assignment. The meaning of the outlying values here is less clear. All values were again considered in the analyses. C, Box plots showing distribution by treatment assignment for the ratio of T-tau to Aβ1–42 concentrations. The ratios for celecoxib- and placebo-assigned participants were typical of other cognitively normal elderly subjects analyzed in the same laboratory [19]. Ratios for naproxen-assigned participants were reduced, compared to placebo, by 40%.

References

    1. A National Alzheimer's Strategic Plan: The Report of the Alzheimer's Study Group. [Accessed: 04 April 2009];Congressional Task Force on Alzheimer's Disease. http://www.alzstudygroup.org/Portals/0/National_Alzheimers_Strategic_Pla....
    1. Sonnen JA, Montine KS, Quinn JF, Kaye JA, Breitner JC, Montine TJ. Biomarkers for cognitive impairment and dementia in elderly people. Lancet Neurol. 2008;7(8):704–714. - PMC - PubMed
    1. Miller SL, Celone K, DePeau K, Diamond E, Dickerson BC, Rentz D, Pihlajamaki M, Sperling RA. Age-related memory impairment associated with loss of parietal deactivation but preserved hippocampal activation. Proc Natl Acad Sci U S A. 2008;105(6):2181–2186. - PMC - PubMed
    1. Selkoe DJ. Soluble oligomers of the amyloid beta-protein impair synaptic plasticity and behavior. Behav Brain Res. 2008;192(1):106–113. - PMC - PubMed
    1. Morrison JH, Hof PR. Life and death of neurons in the aging brain. Science. 1997;278(5337):412–419. - PubMed

Publication types

MeSH terms