. 2011 Aug;22(8):1462-74.
doi: 10.1681/ASN.2010121308. Epub 2011 Jul 22.

TGF-β/Smad3 signaling promotes renal fibrosis by inhibiting miR-29

Affiliations

TGF-β/Smad3 signaling promotes renal fibrosis by inhibiting miR-29

Wei Qin et al. J Am Soc Nephrol. 2011 Aug.

Abstract

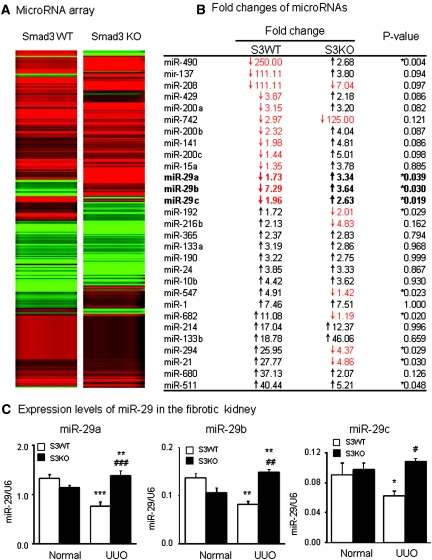
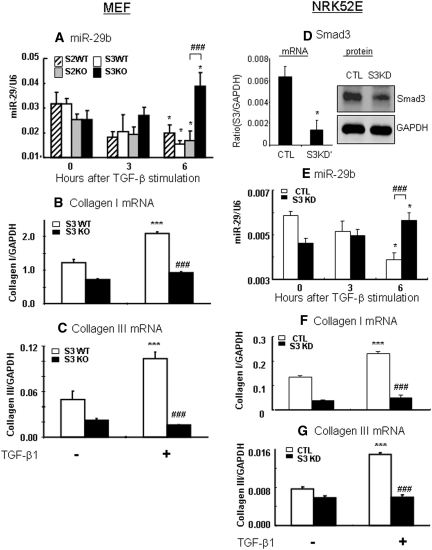
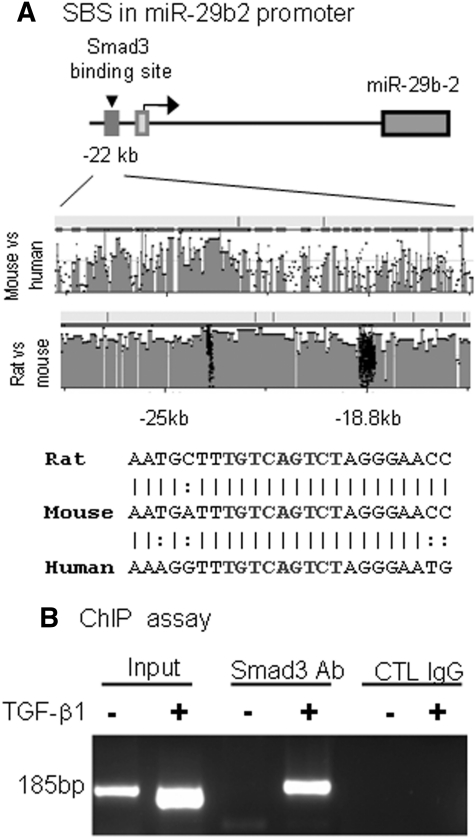
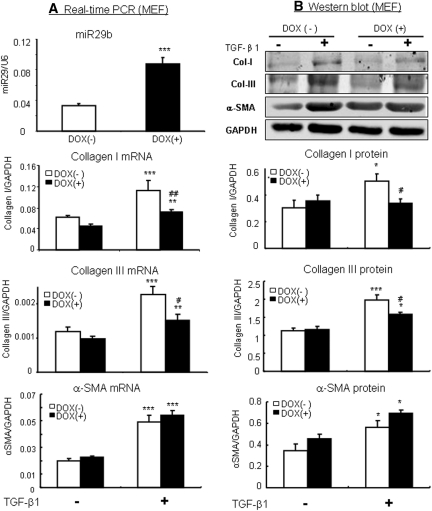
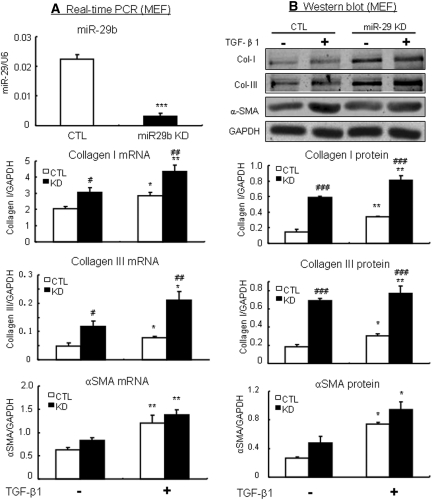
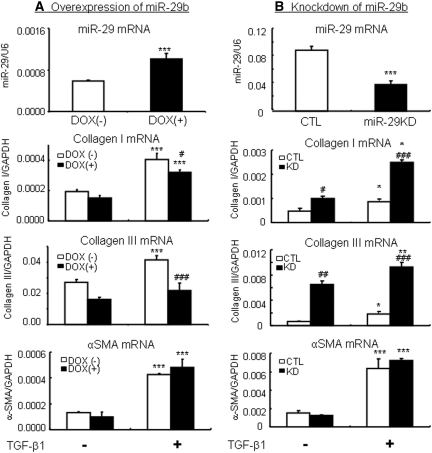
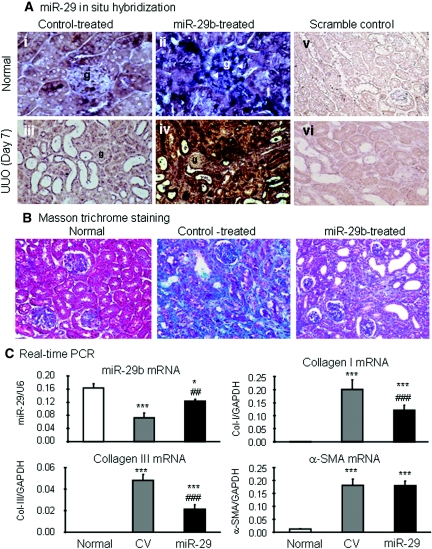
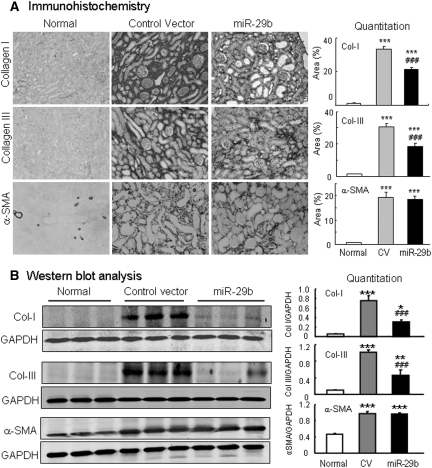
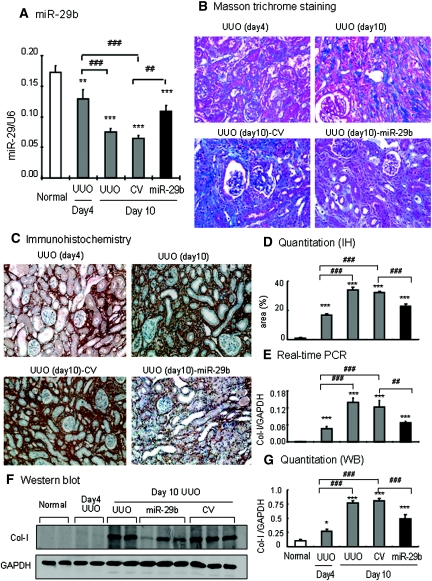
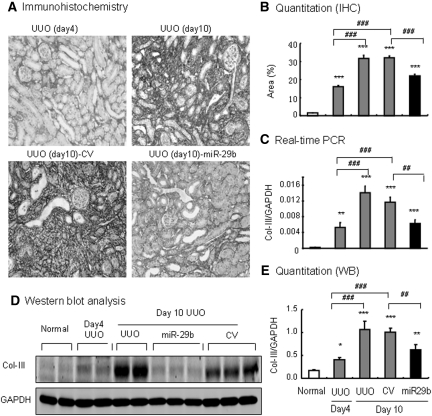
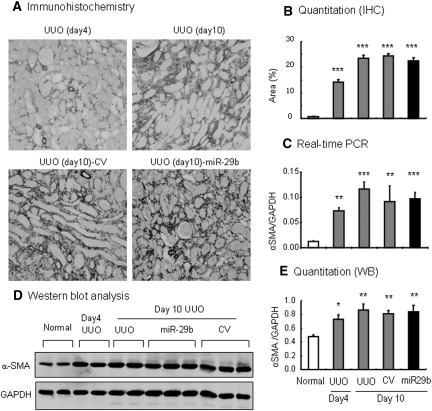
TGF-β/Smad3 signaling promotes fibrosis, but the development of therapeutic interventions involving this pathway will require the identification and ultimate targeting of downstream fibrosis-specific genes. In this study, using a microRNA microarray and real-time PCR, wild-type mice had reduced expression of miR-29 along with the development of progressive renal fibrosis in obstructive nephropathy. In contrast, Smad3 knockout mice had increased expression of miR-29 along with the absence of renal fibrosis in the same model of obstruction. In cultured fibroblasts and tubular epithelial cells, Smad3 mediated TGF-β(1)-induced downregulation of miR-29 by binding to the promoter of miR-29. Furthermore, miR-29 acted as a downstream inhibitor and therapeutic microRNA for TGF-β/Smad3-mediated fibrosis. In vitro, overexpression of miR-29b inhibited, but knockdown of miR-29 enhanced, TGF-β(1)-induced expression of collagens I and III by renal tubular cells. Ultrasound-mediated gene delivery of miR-29b either before or after established obstructive nephropathy blocked progressive renal fibrosis. In conclusion, miR-29 is a downstream inhibitor of TGF-β/Smad3-mediated fibrosis and may have therapeutic potential for diseases involving fibrosis.


Figures

Figure 1.
Figure 1.
miRNA array and real-time PCR detect that the miR-29 family is lost in the UUO kidney of Smad3 WT, but increases in Smad3 KO mice. (A) miRNA expression profile in the UUO kidney of Smad3 WT and KO mice. (B) List of fold changes of miRNAs in the UUO kidney in Smad3 WT and KO mice. The data are normalized to normal Smad3 WT or KO mice. (C) Real-time PCR results of miR-29 family members expression in Smad3 WT and KO mice. Each bar represents the mean ± SEM for at least five mice. *P < 0.05, **P < 0.01, ***P < 0.001 versus normal mice; #P < 0.05, ##P < 0.01, ###P < 0.001 versus Smad3 WT UUO.
Figure 2.
Figure 2.
TGF-β1 downregulates miR-29b and upregulates collagen I and III expression via the Smad3-dependent, not Smad2-dependent, mechanism. (A) Real-time PCR shows that TGF-β1 downregulates miR-29b expression in Smad3 WT, which is enhanced in Smad3 KO MEF. In contrast, MEF lacking Smad2 shows no protective effect on TGF-β1-downregulated miR-29b expression. (B and C) Collagen I and III mRNA expression in Smad3 WT and KO MEF in response to TGF-β1 (2 ng/ml). (D) Real-time PCR and Western blot analysis detect that Smad3 is significantly deleted from NRK52E cells that are stably expressed Smad3 siRNA. (E) Real-time PCR shows that TGF-β1 downregulates miR-29b expression in NRK52E cells, which is significantly enhanced in Smad3 knockdown NRK52E cells when compared with empty vector control NRK52E cells. (F and G) Collagen I and III mRNA expression in Smad3 KD and control NRK52E cells. Each bar represents the mean ± SEM for at least four independent experiments. *P < 0.05, **P < 0.01, ***P < 0.001 versus baseline levels; #P < 0.05, ##P < 0.01, ###P < 0.001 versus Smad3 KO or KD cells or as indicated. CTL, control.
Figure 3.
Figure 3.
Smad3 interacts with miR-29b2 promoter. (A) Sequence analysis shows that a Smad3-binding site (SBS) locates at the promoter region 22 kb upstream of miR-29b2. DNA sequence alignments indicate a highly conserved binding site between species. (B) ChIP assay shows that Smad3 physically binds miR-29b2 promoter in response to TGF-β1 (2 ng/ml for 24 hours).
Figure 4.
Figure 4.
Overexpression of miR-29b in MEF cells inhibits TGF-β1-induced collagen I and III, but not α-SMA expression. (A) Real-time PCR. (B) Western blotting. The results show that the addition of doxycycline (DOX, 2 μg/ml for 24 hours) induces miR-29b expression in a Dox-inducible miR-29b expressing MEF cells (Smad3WT), thereby blocking TGF-b1 (2 ng/ml)-induced collagen I and III expression. Note that overexpression of miR-29b has no effect on α-SMA expression. Each bar represents the mean ± SEM for at least four independent experiments. *P < 0.05, **P < 0.01, ***P < 0.001 versus baseline levels; #P < 0.05, ##P < 0.01, ###P < 0.001 versus nondoxycycline-treated cells.
Figure 5.
Figure 5.
Knockdown of miR-29b in MEF cells enhances TGF-β1-induced collagen I and III expression but not α-SMA expression. (A) Real-time PCR. (B) Western blotting. The results show that stable knockdown of miR-29b in MEF cells (Smad3WT) significantly enhances TGF-β1 (2 ng/ml)-induced collagen I and III expression but not α-SMA expression. Note that knockdown of miR-29b also significantly enhances constitutive levels of collagen I and III mRNA and protein expression without TGF-β1 stimulation. Each bar represents the mean ± SEM for at least four independent experiments. *P < 0.05, **P < 0.01, ***P < 0.001 versus baseline levels; #P < 0.05, ##P < 0.01, ###P < 0.001 versus control cells. CTL, control.
Figure 6.
Figure 6.
Overexpression of miR-29b inhibits, but knockdown of miR-29b promotes, TGF-β1-induced collagen I and III expression by NRK52E cells. (A) Real-time PCR shows that addition of doxycycline (DOX, 2 μg/ml for 24 hours) induces miR-29b expression in a Dox-inducible miR-29b expressing NRK52E tubular epithelial cell line, thereby blocking TGF-β1 (2 ng/ml)-induced collagen I and III mRNA expression. (B) In contrast, stable knockdown of miR-29β in NRK52E cells significantly enhances TGF-β1 (2 ng/ml)-induced collagen I and III mRNA expression. Note that the change in miR-29b expression has no effect on α-SMA expression. Each bar represents the mean ± SEM for at least four independent experiments. *P < 0.05, **P < 0.01, ***P < 0.001 versus baseline levels; #P < 0.05, ##P < 0.01, ###P < 0.001 versus nondoxycycline-treated cells or vector control cells (CTL).
Figure 7.
Figure 7.
Ultrasound-microbubble-mediated miR-29b gene transfer prevents renal fibrosis in a mouse model of UUO nephropathy at day 7. (A) In situ hybridization shows that moderate expression of miR-29b is found in normal glomerular and tubulointerstitial cells (i) and is largely enhanced by ultrasound-mediated miR-29 transfer, resulting in higher levels of miR-29b expression, particularly by mesangial cells (arrowheads), arterial wall, and TEC (ii). In the UUO kidney treated with control plasmid, miR-29 expression is largely reduced (iii) but is remarkably increased with ultrasound-mediated miR-29 gene therapy (iv). (v and vi) Scramble control. (B) Masson trichrome stain detects that severe renal fibrosis (green materials) is developed in the control-treated UUO kidney but largely reduced in the UUO kidney treated with miR-29. (C) Real-time PCR shows that miR-29 gene therapy prevents reduction of miR-29, thereby inhibiting collagen I and III but not α-SMA mRNA expression. Each bar represents the mean ± SEM for at least six mice. *P < 0.05, **P < 0.01, ***P < 0.001 versus normal mice; #P < 0.05, ##P < 0.01, ###P < 0.001 versus control vector (CV)-treated mice. Magnifications, ×900 (A, i and ii); ×200 (A, iii through vi and B).
Figure 8.
Figure 8.
Ultrasound-microbubble-mediated miR-29b gene transfer prevents renal fibrosis in a mouse model of UUO nephropathy at day 7. (A) Immunohistochemistry. (B) Western blotting. The results show that ultrasound-mediated miR-29 gene therapy inhibits collagen I and III expression and deposition, but not α-SMA expression and myofibroblast accumulation in the UUO kidney. Each micrograph or bar represents the mean ± SEM for at least six mice. *P < 0.05, **P < 0.01, ***P < 0.001 versus normal mice; ###P < 0.001 versus control vector (CV)-treated mice. Magnification, ×100.
Figure 9.
Figure 9.
Ultrasound-microbubble-mediated miR-29b gene transfer holds progressive renal fibrosis in an established mouse model of UUO nephropathy at day 10. (A) Real-time PCR for miR-29b expression. (B) Masson trichrome stain. (C) Immunohistochemistry for collagen I deposition. (D) Quantitative analysis of collagen I deposition within the UUO kidney. (E) Real-time PCR for collagen I mRNA expression. (F) Western blotting (WB). (G) Quantitative analysis of collagen I expression by Western blotting. The results show that ultrasound-mediated miR-29b gene therapy from day 4 of UUO restores the loss of miR-29b and holds progressive renal fibrosis such as collagen I expression and disposition as determined by histology, immunohistochemistry, real-time PCR, and Western blotting. Each micrograph or bar represents the mean ± SEM for at least six mice. *P < 0.05, ***P < 0.001 versus normal mice; ##P < 0.01, ###P < 0.001 versus control vector (CV)-treated mice or as indicated. Magnification, ×200. IHC, immunohistochemistry.
Figure 10.
Figure 10.
Ultrasound-microbubble-mediated miR-29b gene transfer blocks collagen III expression in an established mouse model of UUO nephropathy at day 10. (A) Immunohistochemistry for collagen III deposition. (B) Quantitative analysis of collagen III deposition within the UUO kidney. (C) Real-time PCR for collagen III mRNA expression. (D) Western blotting (WB) for collagen III expression. (E) Quantitative analysis of collagen III expression detected by Western blotting. The results show that ultrasound-mediated miR-29b gene therapy from day 4 of UUO holds progressive renal fibrosis such as collagen III expression and disposition as determined by immunohistochemistry, real-time PCR, and Western blotting. Each micrograph or bar represents the mean ± SEM for at least six mice. *P < 0.05, **P < 0.01, ***P < 0.001 versus normal mice; ##P < 0.01, ###P < 0.001 versus control vector (CV)-treated mice. Magnification, ×200. IHC, immunohistochemistry.
Figure 11.
Figure 11.
Ultrasound-microbubble-mediated miR-29b gene transfer has no effect on expression of α-SMA in an established mouse model of UUO nephropathy at day 10. (A) Immunohistochemistry. (B) Quantitative analysis of immunostaining. (C) Real-time PCR. (D) Western blotting (WB). (E) Quantitative analysis of Western blots. The results show that ultrasound-mediated miR-29b gene therapy from day 4 of UUO does not influence α-SMA expression and α-SMA+ myofibroblast accumulation. Each micrograph or bar represents the mean ± SEM for at least six mice. Magnification, ×200. IHC, immunohistochemistry; CV, control vector.

Similar articles

Cited by

References

    1. Lan HY: Smad7 as a therapeutic agent for chronic kidney diseases. Front Biosci 13: 4984–4992, 2008 - PubMed
    1. Roberts AB, Tian F, Byfield SD, Stuelten C, Ooshima A, Saika S, Flanders KC: Smad3 is key to TGF-beta-mediated epithelial-to-mesenchymal transition, fibrosis, tumor suppression and metastasis. Cytokine Growth Factor Rev 17: 19–27, 2006 - PubMed
    1. Wang W, Huang XR, Canlas E, Oka K, Truong LD, Deng C, Bhowmick NA, Ju W, Bottinger EP, Lan HY: Essential role of Smad3 in angiotensin II-induced vascular fibrosis. Circ Res 98: 1032–1039, 2006 - PMC - PubMed
    1. Yang F, Huang XR, Chung AC, Hou CC, Lai KN, Lan HY: Essential role for Smad3 in angiotensin II-induced tubular epithelial-mesenchymal transition. J Pathol 221: 390–401, 2010 - PubMed
    1. Chung AC, Zhang H, Kong YZ, Tan JJ, Huang XR, Kopp JB, Lan HY: Advanced glycation end-products induce tubular CTGF via TGF-beta-independent Smad3 signaling. J Am Soc Nephrol 21: 249–260, 2010 - PMC - PubMed

Publication types