. 2011 Oct;193(19):5138-46.
doi: 10.1128/JB.00198-11. Epub 2011 Jul 22.

Spatial distribution and diffusive motion of RNA polymerase in live Escherichia coli

Affiliations

Spatial distribution and diffusive motion of RNA polymerase in live Escherichia coli

Benjamin P Bratton et al. J Bacteriol. 2011 Oct.

Abstract

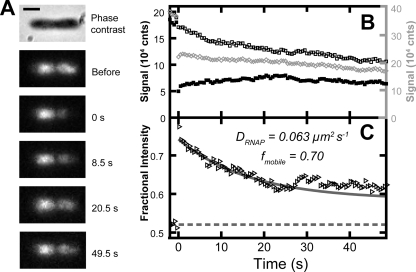
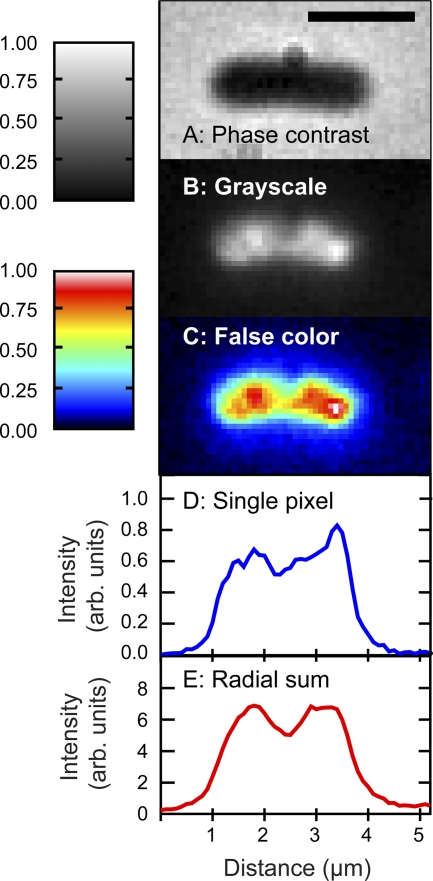
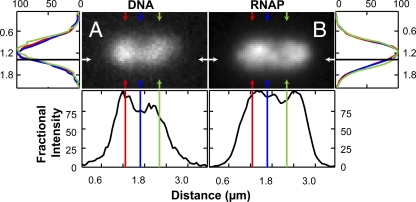
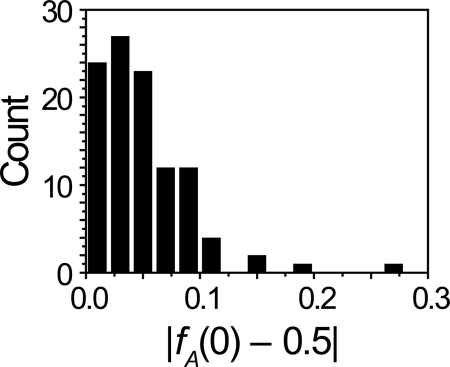
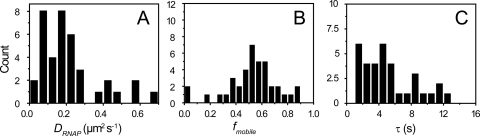
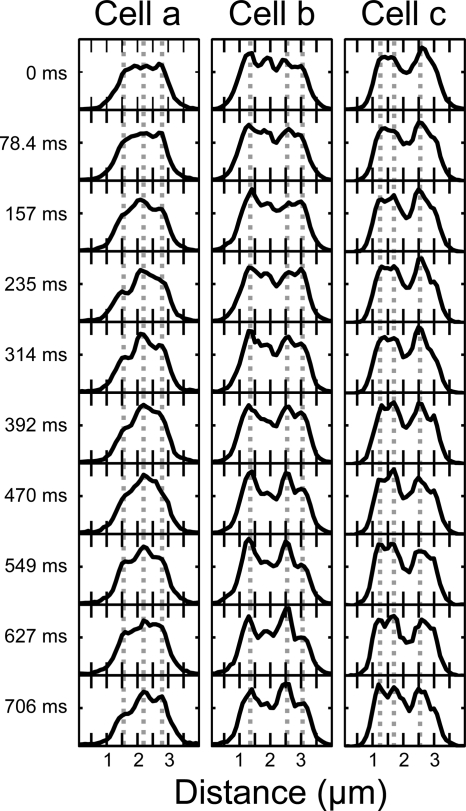
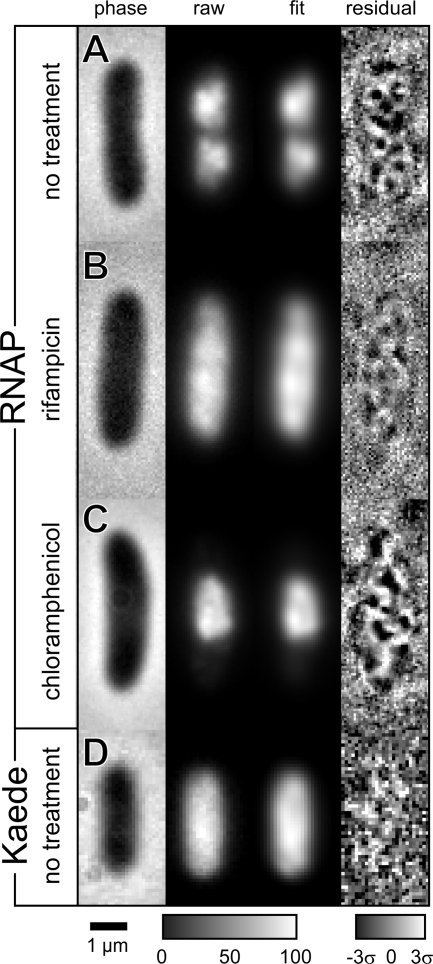
By labeling the β' subunit of RNA polymerase (RNAP), we used fluorescence microscopy to study the spatial distribution and diffusive motion of RNAP in live Escherichia coli cells for the first time. With a 40-ms time resolution, the spatial distribution exhibits two or three narrow peaks of 300- to 600-nm full width at half-maximum that maintain their positions within 60 nm over 1 s. The intensity in these features is 20 to 30% of the total. Fluorescence recovery after photobleaching (FRAP) measures the diffusive motion of RNAP on the 1-μm length scale. Averaged over many cells, 53%±19% of the RNAP molecules were mobile on the 3-s timescale, with a mean apparent diffusion constant <DRNAP> of 0.22±0.16 μm2-s(-1). The remaining 47% were immobile even on the 30-s timescale. We interpret the immobile fraction as arising from RNAP specifically bound to DNA, either actively transcribing or not. The diffusive motion of the mobile fraction (fmobile) probably involves both one-dimensional sliding during nonspecific binding to DNA and three-dimensional hopping between DNA strands. There is significant cell-to-cell heterogeneity in both DRNAP and fmobile.


Figures

Fig. 1.
Fig. 1.
(A) Time course of fluorescence micrographs of RL1314 before and after photobleaching. Each 500-ms frame is normalized by rescaling to the maximum intensity to correct for photobleaching by the probe laser. The scale bar is 1 μm. (B) The integrated intensity in each region of the cell as a function of time. The left half [IA(t), black open squares] and right half [IB(t), black filled squares] of the cell use the ordinate scale to the left, and the total intensity in the cell (gray open diamonds) uses the ordinate scale to the right. (C) Fractional intensity fA(t) as a function of time after the photobleach. The best-fit exponential decay to the first 30 s is plotted as a solid gray line, and the fractional intensity value before the bleach is plotted as a dashed gray line.
Fig. 2.
Fig. 2.
(A) Phase-contrast image of a characteristic cell. (B) Green fluorescence image of the same cell, showing the distribution of RNAP. The grayscale applies to panels A and B. (C) False-color representation for the image in panel B, with corresponding color scale. (D) One-pixel-wide axial intensity profile. (E) Axial intensity profile summed over the entire transverse dimension. Scale bar is 2 μm. The integration time was 200 ms.
Fig. 3.
Fig. 3.
Two fluorescence images of the same cell stained with the DNA-specific dye DRAQ5 (A) and expressing β′-GFP (B). The axial intensity profile is plotted at the location of the white arrowheads; three transverse profiles are plotted for the left (red), center (blue), and right (green) portions of the cell. The profiles are averages over 300-nm-wide swaths (5 pixels) and are normalized to the maximum intensity. The image integration time is 450 ms.
Fig. 4.
Fig. 4.
Histogram of observed fractional intensity for cells without photobleaching. The absolute value of the difference between the measured fractional intensity and the benchmark of equal intensity in both halves (fA = 0.5) is plotted.
Fig. 5.
Fig. 5.
(A) Histogram of effective diffusion constants for RNAP::GFP measured by FRAP. DRNAP was measured for cells plated on polylysine coverslips with 30°C aerated growth medium flowing over them. (B) Histogram of observed fractions of RNAP molecules able to redistribute to the other half of the cell on the 30-s timescale. (C) Histogram of time constants from fits of fractional intensity to equation 1.
Fig. 6.
Fig. 6.
Three-hundred-nanometer-wide axial fluorescence intensity distributions as a function of time for three different cells imaged at 78.4 ms/frame. Peaks seem to remain in the same position while the background fluctuates. Vertical dotted lines are drawn to guide the eye.
Fig. 7.
Fig. 7.
Snapshots (250 ms long) of green fluorescence from E. coli cells under different treatments. (A) RNAP distribution without drug treatment. (B) RNAP distribution following 90 min of treatment with 200 μg/ml rifampin. (C) RNAP distribution following 90 min treatment with 200 μg/ml of chloramphenicol. (D) Kaede, a uniformly distributed cytoplasmic protein. In each row is shown the phase-contrast image, the fluorescence image, the least-squares fit to a sum of eight Gaussian functions, and the weighted residuals plot.

References

    1. Bremer H., Dennis P. P. 1996. Modulation of chemical composition and other parameters of the cell by growth rate, p. 1553–1569 In Neidhardt F. C., et al. (ed.), Escherichia coli and Salmonella: cellular and molecular biology, 2nd ed ASM Press, Washington, DC
    1. Bremer H., Yuan D. 1968. RNA chain growth-rate in Escherichia coli. J. Mol. Biol. 38:163–180 - PubMed
    1. Cabrera J. E., Cagliero C., Quan S., Squires C. L., Jin D. J. 2009. Active transcription of rRNA operons condenses the nucleoid in Escherichia coli: examining the effect of transcription on nucleoid structure in the absence of transertion. J. Bacteriol. 191:4180–4185 - PMC - PubMed
    1. Cabrera J. E., Jin D. J. 2003. The distribution of RNA polymerase in Escherichia coli is dynamic and sensitive to environmental cues. Mol. Microbiol. 50:1493–1505 - PubMed
    1. Elf J., Li G.-W., Xie X. S. 2007. Probing transcription factor dynamics at the single-molecule level in a living cell. Science 316:1191–1194 - PMC - PubMed

Publication types

MeSH terms

Substances

LinkOut - more resources