. 2011 Nov 1;39(20):9034-46.
doi: 10.1093/nar/gkr585. Epub 2011 Jul 23.

Evolutionary genome engineering using a restriction-modification system

Affiliations

Evolutionary genome engineering using a restriction-modification system

Yoko Asakura et al. Nucleic Acids Res. .

Abstract

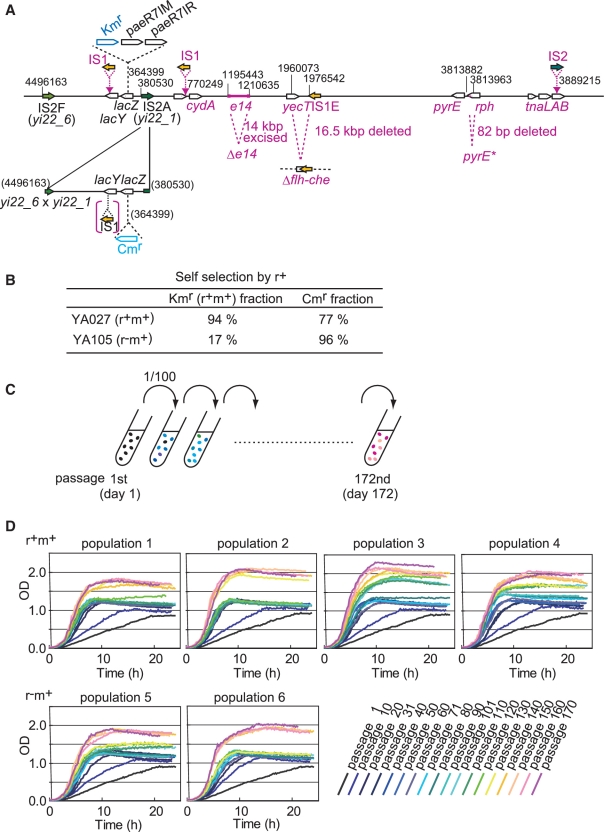
Modification of complex microbial cellular processes is often necessary to obtain organisms with particularly favorable characteristics, but such experiments can take many generations to achieve. In the present article, we accelerated the experimental evolution of Escherichia coli populations under selection for improved growth using one of the restriction-modification systems, which have shaped bacterial genomes. This resulted in faster evolutionary changes in both the genome and bacterial growth. Transcriptome/genome analysis at various stages enabled prompt identification of sequential genome rearrangements and dynamic gene-expression changes associated with growth improvement. The changes were related to cell-to-cell communication, the cell death program, as well as mass production and energy consumption. These observed changes imply that improvements in microorganism population growth can be achieved by inactivating the cellular mechanisms regulating fraction of active cells in a population. Some of the mutations were shown to have additive effects on growth. These results open the way for the application of evolutionary genome engineering to generate organisms with desirable properties.


Figures

Figure 1.
Figure 1.
Experimental evolution for growth improvement. (A) Genome map of parental strain YA027 with changes (shown in magenta) identified after experimental evolution. (B) Self-selection by RM system. From a single YA027 colony, 108–9 cells were suspended in LB liquid medium without antibiotics and grown overnight. The culture was diluted 1000-fold and allowed to grow overnight. This procedure was repeated twice more. Resulting clones were tested for antibiotic resistance. Data represent an average of two independent experiments each with 50 clones. (C) Experimental procedure. Four populations of r+m+ strain and two populations of an isogenic rm+ strain were cultured with shaking in amino acid-rich medium with Cm and Km. They were serially propagated by 100-fold dilution daily until passage 172, and growth was monitored. (D) Growth curves after every 10 passages. r+ phenotype, as measured by λ-assay (23), was maintained by 100% (30/30) of clones at passages 42, 100 and 172 in all r+ populations.
Figure 2.
Figure 2.
Acceleration of evolution by RM system. (A) Change in initial growth, as measured by OD increase per h in first 4 h, during experimental evolution. (B) Genome rearrangements at passage 11 as measured by IS element polymorphism. Ten clones from each of six populations examined. For each population, difference score obtained as sum of number of newly appearing or disappearing bands compared with parental strain. Averages of difference scores for r+m+ and rm+ genotypes are shown.
Figure 3.
Figure 3.
Properties of clones isolated from population at different evolutionary stages. Clones are labeled [population (culture) number] − [passage number] – [clone number].
Figure 4.
Figure 4.
Transcriptome changes during adaptive evolution. (A) Functional category distribution. Genes differentially expressed compared with parental strain were classified according to function using Clusters of Orthologous Groups (COG) codes (http://www.ncbi.nlm.nih.gov/COG/new/) with an additional J’ category. Colors show significance of category over-representation based on χ2-test. Gene numbers shown at bottom of each column, and numbers of genes commonly up- or down-regulated in all three or four clones selected at each passage shown in parentheses. (B) Dynamics. (i) Genes with differential expression in either of selected clones compared with parental strain hierarchically clustered. Transcript level of each gene normalized to that of parental strain (yellow). (ii) Standard correlations of transcriptome measurements between each clone and parental strain. (C) Genes with significantly more (up-regulated) or fewer (down-regulated) transcripts shared by clones at passages 11, 84 and 172. (i) Venn diagram. Each circle shows number of shared genes with significantly more (up-regulated) or fewer (down-regulated) transcripts compared with parental strain for clones at passages 11, 84 and 172, respectively. Among genes with shared transcript changes in three clones at passage 172, transcription of more than half had already shown similar changes in all clones isolated from passage 11 (I). (ii) Examples of genes shown in Venn diagram (for details see Supplementary Table S8).
Figure 4.
Figure 4.
Transcriptome changes during adaptive evolution. (A) Functional category distribution. Genes differentially expressed compared with parental strain were classified according to function using Clusters of Orthologous Groups (COG) codes (http://www.ncbi.nlm.nih.gov/COG/new/) with an additional J’ category. Colors show significance of category over-representation based on χ2-test. Gene numbers shown at bottom of each column, and numbers of genes commonly up- or down-regulated in all three or four clones selected at each passage shown in parentheses. (B) Dynamics. (i) Genes with differential expression in either of selected clones compared with parental strain hierarchically clustered. Transcript level of each gene normalized to that of parental strain (yellow). (ii) Standard correlations of transcriptome measurements between each clone and parental strain. (C) Genes with significantly more (up-regulated) or fewer (down-regulated) transcripts shared by clones at passages 11, 84 and 172. (i) Venn diagram. Each circle shows number of shared genes with significantly more (up-regulated) or fewer (down-regulated) transcripts compared with parental strain for clones at passages 11, 84 and 172, respectively. Among genes with shared transcript changes in three clones at passage 172, transcription of more than half had already shown similar changes in all clones isolated from passage 11 (I). (ii) Examples of genes shown in Venn diagram (for details see Supplementary Table S8).
Figure 5.
Figure 5.
Genome changes. tnaAB::IS, Δflh-che and IS-cydA showed variation in IS elements and positions of insertions as shown in (A, B and D). Variants scored as a mutant form in (E and F). (A) tnaAB::IS. Insertion of IS element into tnaLAB operon for synthesis of indole. Two variants were found: IS2 insertion into tnaB (clones 3-11-1, 3, 4, 7, 9 and 3-84-1∼5, 7∼10), and IS5 insertion into tnaA (3-84-6). (B) Δflh-che. Deletion of region including genes involved in flagella synthesis and chemotaxis, resulting from IS1E-mediated adjacent deletion. From middle of yecT to IS1E, 16 454-bp deletion (clones 3-11-1,3, 5, 6, 7, 8, 9, 10 and 3-84-1–10), and 16 055-bp deletion from upstream of flhE to IS1E (clones 6-11-7 and 6-84-1, 2) were found. (C) pyrE*. In rph-pyrE operon, 82-bp deletion (light blue) lies within rph gene and upstream of pyrE attenuator, and probably resulted from recombination involving two 10-bp regions of sequence identity (yellow box). (D) IS-cydA. Insertion of IS element upstream of cydAB operon. IS1 insertion (3-84-4, 5, 8, 9, 10), and IS5 insertion (3-84-6) were found. (E) Distribution of six mutations among clones of population 3. Representative clones used in transcriptome and further analysis shown in blue. (F) Temporal and inter-population distribution of six mutations. Ten clones analyzed for each population to obtain frequency.
Figure 6.
Figure 6.
Growth of strains constructed by introduction of identified mutations into parental strain. Results of two independent experiments are shown.

Similar articles

Cited by

References

    1. Tyo KEJ, Kocharin K, Nielsen J. Toward design-based engineering of industrial microbes. Curr. Opin. Microbiol. 2010;13:255–262. - PMC - PubMed
    1. Ideker T, Galitski T, Hood L. A new approach to decoding life: systems biology. Annu. Rev. Genomics. Hum. Genet. 2001;2:343–372. - PubMed
    1. Glass JI, Assad-Garcia N, Alperovich N, Yooseph S, Lewis MR, Maruf M, Hutchison CA, III, Smith HO, Venter JC. Essential genes of a minimal bacterium. Proc. Natl Acad. Sci. USA. 2006;103:425–430. - PMC - PubMed
    1. Posfai G, Plunkett G, III, Feher T, Frisch D, Keil GM, Umenhoffer K, Kolisnychenko V, Stahl B, Sharma SS, de Arruda M, et al. Emergent properties of reduced-genome Escherichia coli. Science. 2006;312:1044–1046. - PubMed
    1. Hashimoto M, Ichimura T, Mizoguchi H, Tanaka K, Fujimitsu K, Keyamura K, Ote T, Yamakawa T, Yamazaki Y, Mori H, et al. Cell size and nucleoid organization of engineered Escherichia coli cells with a reduced genome. Mol. Microbiol. 2005;55:137–149. - PubMed

Publication types

MeSH terms

Substances