. 2011 Aug;121(8):3306-19.
doi: 10.1172/JCI57413. Epub 2011 Jul 25.

Altered chromatin architecture underlies progressive impairment of the heat shock response in mouse models of Huntington disease

Affiliations

Altered chromatin architecture underlies progressive impairment of the heat shock response in mouse models of Huntington disease

John Labbadia et al. J Clin Invest. 2011 Aug.

Abstract

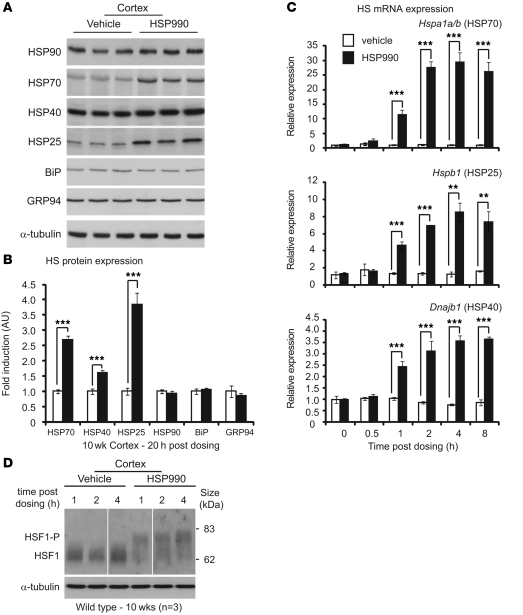
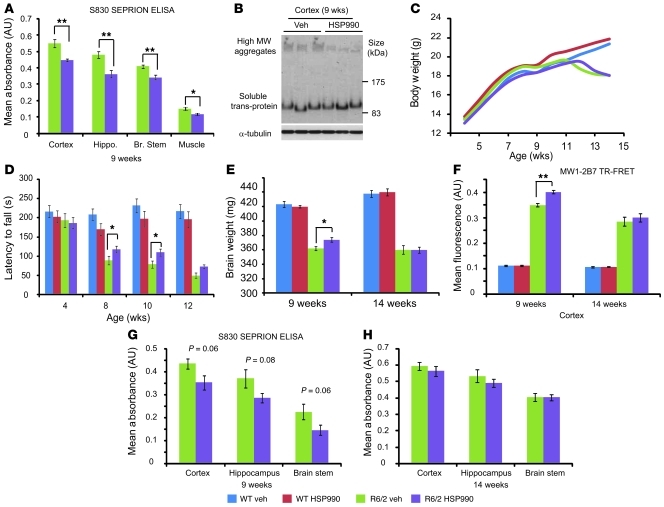
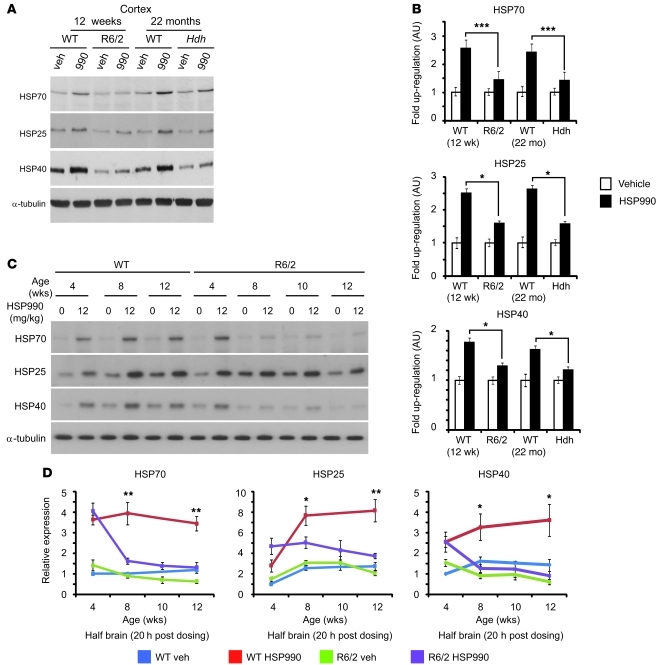
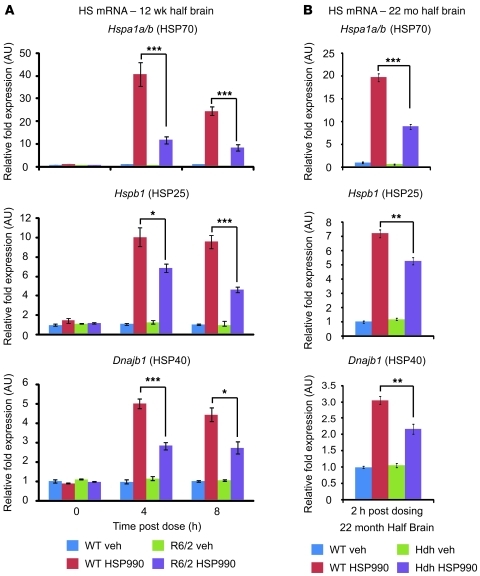
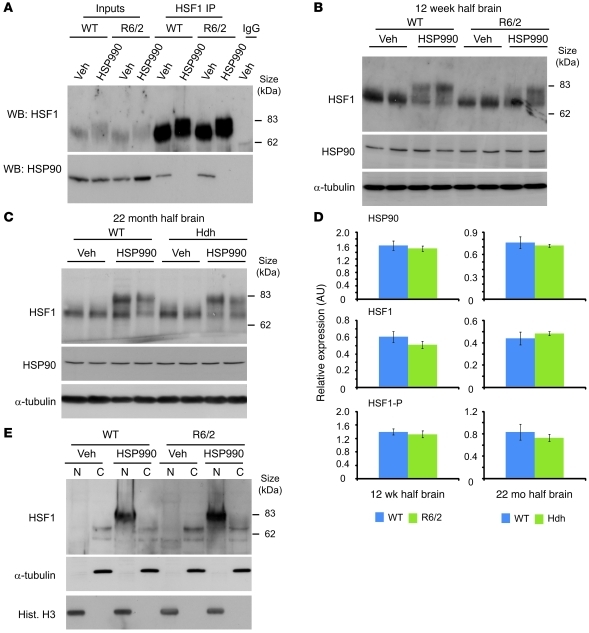
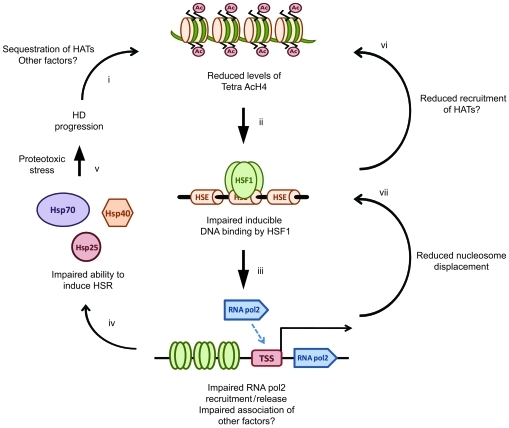
Huntington disease (HD) is a devastating neurodegenerative disorder for which there are no disease-modifying treatments. Previous studies have proposed that activation of the heat shock response (HSR) via the transcription factor heat shock factor 1 (HSF1) may be of therapeutic benefit. However, the effect of disease progression on the HSR and the therapeutic potential of this pathway are currently unknown. Here, we used a brain-penetrating HSP90 inhibitor and physiological, molecular, and behavioral readouts to demonstrate that pharmacological activation of HSF1 improves huntingtin aggregate load, motor performance, and other HD-related phenotypes in the R6/2 mouse model of HD. However, the beneficial effects of this treatment were transient and diminished with disease progression. Molecular analyses to understand the transient nature of these effects revealed altered chromatin architecture, reduced HSF1 binding, and impaired HSR accompanied disease progression in both the R6/2 transgenic and HdhQ150 knockin mouse models of HD. Taken together, our findings reveal that the HSR, a major inducible regulator of protein homeostasis and longevity, is disrupted in HD. Consequently, pharmacological induction of HSF1 as a therapeutic approach to HD is more complex than was previously anticipated.


Figures

Figure 1
Figure 1. NVP-HSP990 elicits an HSR in mouse brain after acute oral administration.
(A) Western blots of HSR and UPR proteins in 10-week-old WT mouse cortex 20 hours after treatment with HSP990 (12 mg/kg) or vehicle. (B) Fold upregulation of HSPs in HSP990-treated WT mice (black) was calculated relative to vehicle-treated WT mice (white) by densitometry. Values are mean ± SEM fold induction (n = 6 per treatment group). (C) Mouse cortices (WT) were harvested 0, 0.5, 1, 2, 4, and 8 hours after a single dose of HSP990 (12 mg/kg) or vehicle. Taqman RT-qPCR was used to determine the fold induction of HS genes relative to expression in the vehicle group 0 hours after dosing. Values (mean ± SEM) were calculated by the ΔCt method, normalized to the housekeeping gene Atp5b (n = 4 per treatment group). (D) Western blotting for HSF1 in cortices of 10-week-old WT mice harvested 1, 2, and 4 hours after an acute dose of HSP990 (12 mg/kg) or vehicle (n = 3 per treatment group). HSF1-P, hyperphosphorylated form of HSF1. Lanes were run on the same gel but were noncontiguous (white lines). **P < 0.01, ***P < 0.001, Student’s t test.
Figure 2
Figure 2. HSP990 treatment transiently improves rotarod performance and reduces aggregate load in R6/2 mice.
(A) Seprion ligand ELISA was used to quantify aggregate load in tissues of R6/2 mice after treatment for 4 weeks with vehicle (green) or HSP990 (purple). Values were plotted as mean absorbance ± SEM (n = 6 per treatment group). (B) Western blotting and immunodetection with S830 was used to obtain visual representation of results in A. (C and D) Assessment of (C) body weight and (D) rotarod ability with age. (E) Brain weight in 9- and 14-week-old mice after vehicle or HSP990 treatment. Values are presented as mean ± SEM (n = 12 per group). (FH) R6/2 brain tissues were harvested from 9-week-old satellite or end-of-trial mice (14 weeks). (F) 2B7-MW1 TR-FRET was used to determine levels of soluble exon 1 in mouse cortices after vehicle or HSP990 treatment. Values are presented as mean ± SEM for each group (n ≥ 4 per treatment group). (G and H) S830 Seprion ligand ELISA was used to measure aggregate load after HSP990 treatment at (G) 9 weeks (n = 4 per treatment group) and (H) 14 weeks of age (n ≥ 6 per treatment group). *P < 0.05, **P < 0.01, 1-way ANOVA (C and D) or Student’s t test (A, B, and EH).
Figure 3
Figure 3. HSP upregulation is impaired in HD mouse models.
(A) Representative Western blots of HSP70, HSP25, HSP40, and α-tubulin expression in WT, R6/2 or HdhQ150/Q150 (Hdh) cortex 20 hours after treatment with vehicle or HSP990 (12 mg/kg). (B) Immunoblotting and densitometry were used to calculate the expression levels of HSP70, HSP25, and HSP40 in mouse cortex relative to levels of α-tubulin. Fold expression of each chaperone was calculated for HSP990 relative to vehicle. Values are mean fold ± SEM (n ≥ 4 per treatment group). (C) Representative Western blots of HSP70, HSP25, HSP40, and α-tubulin in half brain of 4-, 8-, 10-, and 12-week-old WT or R6/2 mice 20 hours after treatment with vehicle or HSP990 (12 mg/kg). (D) Relative expression of HSP70, HSP25, and HSP40 at 20 hours after treatment with HSP990 (12 mg/kg) or vehicle, calculated relative to α-tubulin by densitometry. Fold expression relative to vehicle-treated 4-week-old WT mice was calculated for each chaperone and age, and values are mean ± SEM (n = 4). *P < 0.05, **P < 0.01, ***P < 0.001, Student’s t test.
Figure 4
Figure 4. Impaired upregulation of HSPs occurs at the level of transcription.
Taqman RT-qPCR of Hspa1a/b, Hspb1, and Dnajb1 was performed on half brains of 12-week-old WT and R6/2 mice 0, 4, or 8 hours after treatment with vehicle or HSP990 (12 mg/kg) (A), or on half brains of 22-month-old WT and HdhQ150/Q150 mice 2 hours after treatment with vehicle or HSP990 (B). (Due to the reduced availability of mice aged 22 months, HdhQ150/Q150 analysis was performed at 2 hours after dose to allow investigation of mRNA levels and chromatin architecture on the same samples.) Chaperone mRNA expression levels were normalized to the housekeeping gene Atp5b. Fold induction of each HS gene after HSP990 treatment was calculated relative to expression levels of WT vehicle groups 0 hours after treatment, and expressed as mean fold ± SEM (n = 4 per treatment group). *P < 0.05, **P < 0.01, ***P < 0.001, Student’s t test.
Figure 5
Figure 5. HSF1 dissociates from HSP90, becomes hyperphosphorylated, and translocates to the nucleus upon HSP990 treatment.
(A) Western blots of HSF1 and HSP90 after HSF1 IP from 12-week-old WT and R6/2 mouse brains 2 hours after treatment with vehicle or HSP990 (12 mg/kg). (B and C) Representative Western blots of HSF1 and HSP90 in (B) 12-week-old WT and R6/2 or (C) 22-month-old WT and HdhQ150/Q150 mouse half brains 2 hours after treatment with vehicle or HSP990 (12 mg/kg). α-Tubulin was used as a loading control. (D) Expression of HSP90 and HSF1 relative to α-tubulin, or phosphorylated HSF1 (HSF1-P) relative to unphosphorylated HSF1, in 12-week-old WT and R6/2 or 22-month-old WT and HdhQ150/Q150 mice. Densitometry values are mean ± SEM (n = 4 per treatment group). (E) Representative Western blots for HSF1 in nuclear and cytoplasmic fractions derived from 12-week-old WT and R6/2 mouse half brains 2 hours after treatment with vehicle or HSP990 (12 mg/kg). Purity of nuclear (N) and cytoplasmic (C) fractions was demonstrated by immunoblotting for α-tubulin and histone H3.
Figure 6
Figure 6. Reduced HSF1 promoter binding and altered nucleosome landscapes are observed at HS loci in R6/2 mice, but do not correlate with chromatin accessibility.
(AE) Levels of HSF1 (A and D), RNA polymerase 2 (RNApol2), H3AcK9, H3AcK27 (B), and Tetra AcH4 (C and E) bound to HS promoters 2 hours after vehicle or HSP990 treatment (12 mg/kg) was determined by ChIP in 12-week-old WT and R6/2 (AC) and 22-month-old WT and HdhQ150/Q150 (D and E) mouse half brains. Chromatin was immunoprecipitated, and SYBR green qPCR was performed on the resulting DNA with primers specific for the Hspa1b, Hspb1, and Dnajb1 promoters. Signal was normalized to 10% of the input for each sample. Values are mean ± SEM (n = 5 per treatment group). Black lines in AE indicate mean signal obtained after pulldown with rabbit IgG alone (n = 2). (F) MNase digestion was performed on chromatin extracted from mouse brain tissue 2 hours after treatment with vehicle or HSP990. SYBR green was then performed using primers spanning the Hspa1b gene. Digested signal was normalized to undigested signal, and values are mean ± SEM (n = 4 per treatment group). *P < 0.05 vs. WT HSP990, #P < 0.05 vs. WT vehicle, Student’s t test.
Figure 7
Figure 7. Proposed model for impairment of the HSR in HD.
Disease pathogenesis in HD leads to a progressive reduction in levels of Tetra AcH4 at HS promoters (i), possibly as a consequence of reduced histone acetyl transferase (HAT) activity. Reduced levels of Tetra AcH4 impair the ability of HSF1 to bind its target consensus sequences at HS genes (ii). Reduced HSF1 binding leads to reduced release and recruitment of RNA polymerase 2 (iii), which in turn results in an inability to efficiently upregulate HSPs (iv). Impairment of the HSR may be augmented by reduced H4 acetylation and nucleosome displacement as a consequence of impairment of HSF1 binding, RNA polymerase 2 release and/or recruitment, and association of other factors (e.g., PARP) (vi and vii). As a consequence, cells become vulnerable to acute proteotoxic stress, thereby accelerating disease progression (v).

Comment in

Similar articles

Cited by

References

    1. Bates G, Harper P, Jones L, eds.Huntington’s Disease . 3rd ed. New York, New York, USA: Oxford University Press; 2002.
    1. Novak MJ, Tabrizi SJ. Huntington’s disease. BMJ. 2010;340:c3109. doi: 10.1136/bmj.c3109. - DOI - PubMed
    1. The Huntington’s Disease Collaborative Research Group A novel gene containing a trinucleotide repeat that is expanded and unstable on Huntington’s disease chromosomes. The Huntington’s Disease Collaborative Research Group. Cell. 1993;72(6):971–983. doi: 10.1016/0092-8674(93)90585-E. - DOI - PubMed
    1. Davies SW, et al. Formation of neuronal intranuclear inclusions underlies the neurological dysfunction in mice transgenic for the HD mutation. Cell. 1997;90(3):537–548. doi: 10.1016/S0092-8674(00)80513-9. - DOI - PubMed
    1. DiFiglia M, et al. Aggregation of huntingtin in neuronal intranuclear inclusions and dystrophic neurites in brain. Science. 1997;277(5334):1990–1993. doi: 10.1126/science.277.5334.1990. - DOI - PubMed

Publication types