. 2011 Jul 24;13(8):903-13.
doi: 10.1038/ncb2285.

esBAF facilitates pluripotency by conditioning the genome for LIF/STAT3 signalling and by regulating polycomb function

Affiliations

esBAF facilitates pluripotency by conditioning the genome for LIF/STAT3 signalling and by regulating polycomb function

Lena Ho et al. Nat Cell Biol. .

Abstract

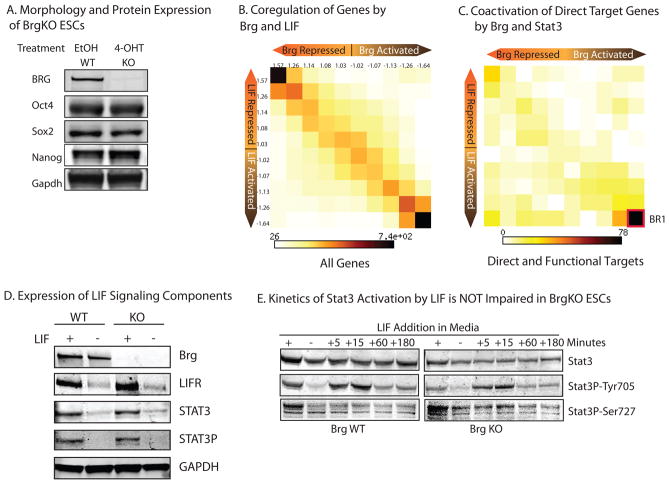
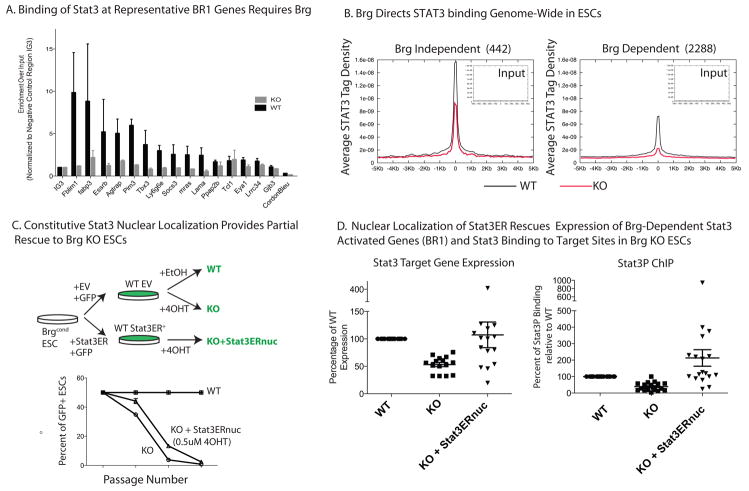
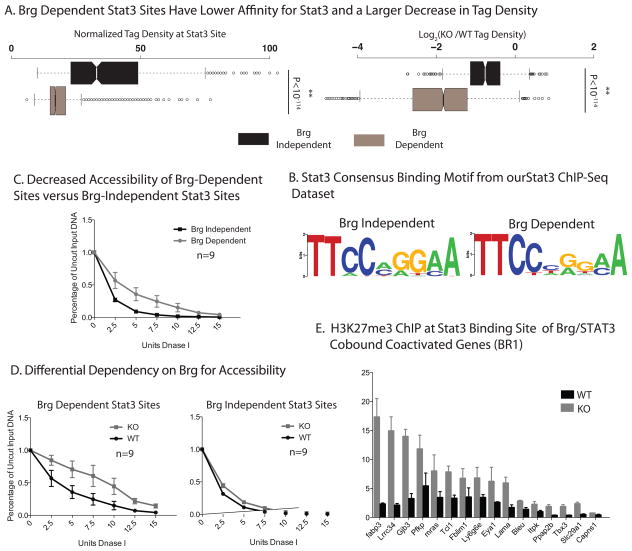
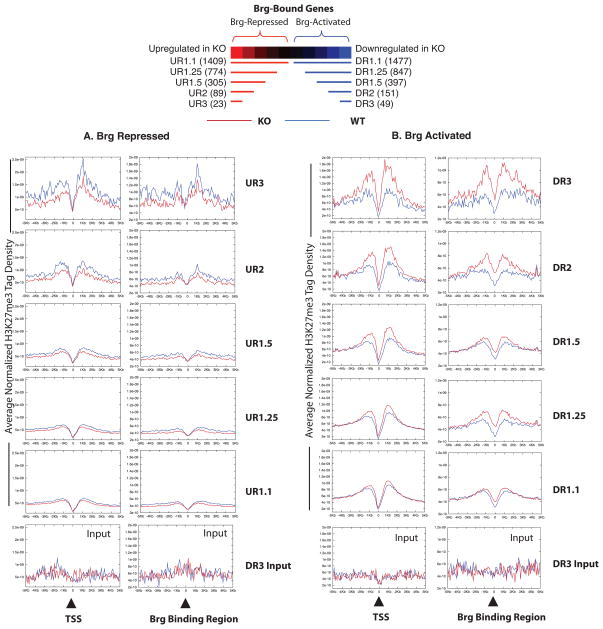
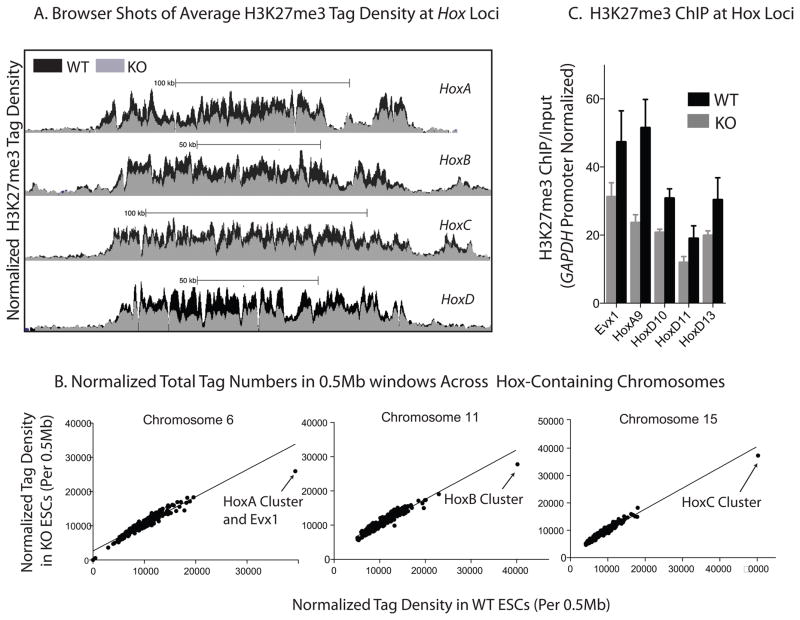
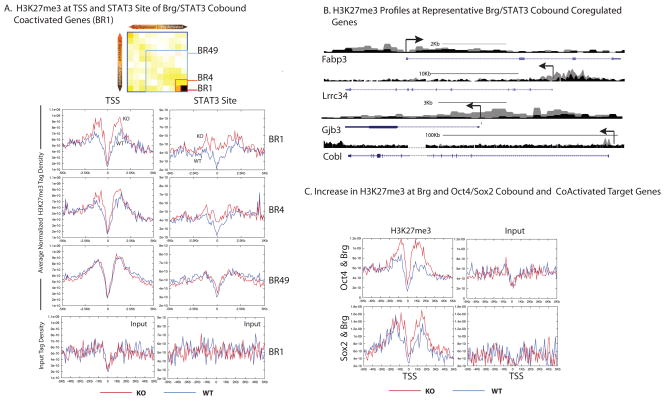
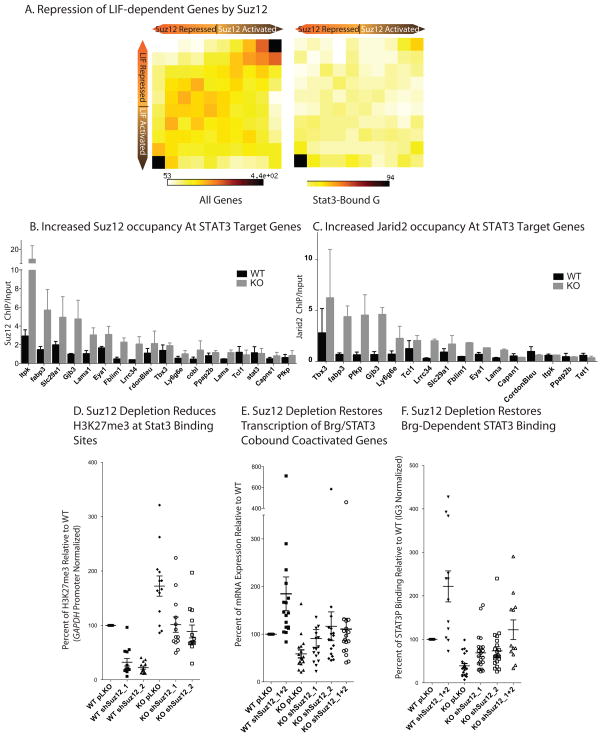
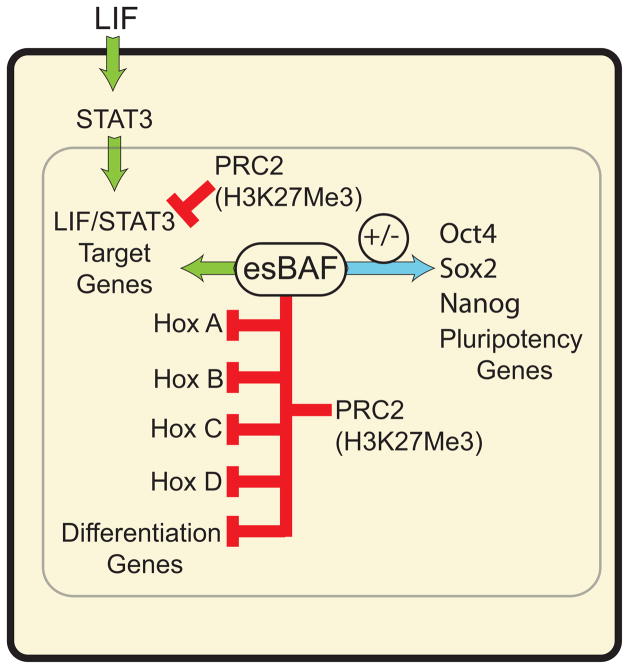
Signalling by the cytokine LIF and its downstream transcription factor, STAT3, prevents differentiation of pluripotent embryonic stem cells (ESCs). This contrasts with most cell types where STAT3 signalling induces differentiation. We find that STAT3 binding across the pluripotent genome is dependent on Brg1, the ATPase subunit of a specialized chromatin remodelling complex (esBAF) found in ESCs. Brg1 is required to establish chromatin accessibility at STAT3 binding targets, preparing these sites to respond to LIF signalling. Brg1 deletion leads to rapid polycomb (PcG) binding and H3K27me3-mediated silencing of many Brg1-activated targets genome wide, including the target genes of the LIF signalling pathway. Hence, one crucial role of Brg1 in ESCs involves its ability to potentiate LIF signalling by opposing PcG. Contrary to expectations, Brg1 also facilitates PcG function at classical PcG targets, including all four Hox loci, reinforcing their repression in ESCs. Therefore, esBAF does not simply antagonize PcG. Rather, the two chromatin regulators act both antagonistically and synergistically with the common goal of supporting pluripotency.


Figures

Figure 1
Figure 1. esBAF Is Dedicated to the LIF/STAT3 Signaling Pathway
A) Western blot showing protein levels of Brg and pluripotent markers after 72hours of treatment of Brgcond ESCs with 4-OHT (BrgKO) or EtOH (BrgWT) vehicle control. Brg protein is completely absent only after 48hours of 4-OHT treatment (data not shown). Full length blots are presented in Figure S9a. (B) 2D matrix and heatmap depicting gene expression changes in BrgKO ESCs and 48hr LIF-starved ESCs compared to WT ESCs for all genes (N=17030). Axes indicate degree of fold change, from nil (middle of axis) to greater than 1.5-fold (outermost square). Numbers indicate the median fold change of genes in each column or row. Intensity of each square represents the number of genes that fall in that square. (C) 2D matrix and heatmap of direct STAT3and Brg targets (binding sites detected from TSS to TES of the same gene) depicting changes in their expression in BrgKO or LIF-withdrawn ESCs. BR1= bottom right 1 corner. (D) STAT3Protein levels in WT versus KO ESCs (72 hours 4OHT STAT3P=Phosphotyrosine705 STAT3; LIFR=LIF receptor)in the presence of LIF (+) or after 18 hours of LIF starvation (−). Full length blots are presented in Figure S9b. (E)Timecourse of STAT3activation in BrgWT and KOESCs. Cells were starved for 18 hours from LIF (−), followed by LIF restimuation for the indicated durations. Full length blots are presented in Figure S9c.
Figure 2
Figure 2. STAT3Binding Genome-Wide Is Brg-Dependent
(A) ChIP assay of STAT3 target regions within BR1 genes in BrgKO and WT ESCs. Y-axis represents input enrichment over input normalized to negative control IG3 region. Error bars = SEM of 3 experiments. See text and SI for gene selection criteria. (B) High resolution ChIP-Seq for total STAT3 levels in BrgWT and KO ESCs. Average tag density (y-axis) of each site called with p<0.01 is plotted against distance in Kb from the center of each STAT3binding sites for WT (black) and KO (grey). (C) Experimental scheme to generate GFP+ Brg WT and KO ESCs expressing the STAT3ER fusion protein. GFP+ cells of the indicated genotype were mixed with GFP- WT ESCs at a 1:1 ratio and the GFP ratio of cultures grown in the presence or absence of 4-OHT was measured at each passage by FACS. Error bars = SEM of 3 technical replicates. Results are representative of 2 independent experiments. (D) mRNA levels of STAT3/Brg cobound and coactivated targets were measured in WT, KO and KO;STAT3ERnuc (nuclear) and expressed as a percentage of WT levels. Each data point represents a distinct gene from BR1. Error bars = SEM of data points. (E) ChIP assay for STAT3P-Tyr705 in WT, KO and KO;STAT3ERnuc. ChIP levels are measured as percent of input, normalized to that of a negative intergenic control IG3, and expressed as a percentage of WT levels.
Figure 3
Figure 3. Brg is essential to enhance accessibility at STAT3target genes
(A)Brg Dependency Corelates with Tag Density of STAT3 Sites. (Left) Box whisker plot of ChIP-seq tag numbers of each STAT3 site in Brg WT ESCs, grouped according to Brg dependency. (Right) Fold change of tag density of each STAT3site in BrgKO ESCs compared to WT ESCs, grouped according to Brg dependency. P-values are calculated using a hypergeometric distribution. (B) Consensus STAT3 binding MOTIFS were calculated by MEME using STAT3 ChIP-Seq dataset from both Brg WT and KO ESCs. (C)DnaseI hypersensitivity assay of Brg-dependent and Brg-Independent STAT3binding sites (n=9 each) (See text and SI for gene selection criteria.). Error bars, s.e.m. of data for nine sites obtained in two experiments. (D)DnaseI assay of Brg dependent and independent sites (n=9 each) in WT ESCs or Brg KO ESCs. Error bars, s.e.m. of data for nine sites obtained in two experiments. (E) H3K27me3 ChIP at the STAT3 binding site of representative Brg-and LIF coactivated genes in WTand BrgKO ESCs. Y-axis represents ChIP/Input ratio for each region, normalized with the ratio at the GAPDH promoter. Error bars = SEM of 3 independent experiments.
Figure 4
Figure 4. Brg Deletion Leads to Genome-wide Increased H3K27Me3 at Brg –Activated Genes and Reduced H3K27Me3 at Brg-Repressed Genes
Average H3K27me3 tag density at transcriptional start site (TSS) of Brg-repressed (A) or Brg-activated (B)genes (defined as Brg-bound genes that undergo transcriptional changein BrgKO ESCs) and atthe corresponding Brg binding regions in WT (blue) versus Brg KO (red) ESCs. These genes were grouped according to the fold changein BrgKO ESCs (i.e. DR3 = 3-fold DOWNregulated, UR3 = 3-fold UPregulated etc.) The number within parentheses besides each set identifier (top panel) denotes the number of genes within that set. Bottom panel illustrates average input tag density of UR3 (for panel A) or DR3(for panel B)genes and is representative of other subsets.
Figure 5
Figure 5. Synergistic Interaction Between Brg and PRC2at Hox Genes
(A) Browser snapshots of average normalized H3K27me3 ChIP-Seq tag density in KO (grey) and WT (black) ESCs at the four Hox loci. (B) Scatter plots of H3K27me3 levels on Hox-containing chromosomes. Each point represents the total number of tags in a particular 0.5Mb window in Brg KO (y-axis) and the total number of tags in the corresponding 0.5Mb window in Brg WT (x-axis) ESCs. If a point falls on the diagonal of the plot, there is a similar overall tag number in that window in Brg KO ESCs compared to WT. The datapoints corresponding to the window containing Hox genes are labeled. (C) H3K27me3 ChIP at the transcriptional start site of Brg-repressed Hox genes in WTand BrgKO ESCs. Y-axis represents ChIP/Input ratio for each region, normalized with the ratio at the GAPDH promoter, which is not H3K27me3 modified in WT or KO ESCs and serves as a negative baseline internal control. Error bars = SEM of 3 independent experiments.
Figure 6
Figure 6. Increased H3K27me3 At Brg and STAT3 Coactivated Genes in BrgKO ESCs
(A) High resolution ChIP-Seq for H3K27me3 levels in BrgWT (blue) and KO (red) ESCs. Stat3 and Brg cobound target genes were grouped according to their degree of coactivation by Brg and Stat3. BR1=highly co-activated to BR49 = not coactivated. Average normalized H3K27me3 tag density across the TSS and over the STAT3 sites of BR1, BR4 and BR49 genes were plotted (y-axis) against the distance in Kb (x-axis) from the TSS or STAT3 site. Lowest panel depicts average input tag density of BR1 genes, and is representative of all subsets. (B) UCSC genome browser shots of H3K27me3 profiles at representative BR1 genes in WT (black) and KO (grey) ESCs. (C) Average H3K27me3 tag desity at TSS of all Brg and Oct4 (top, n=70) and Brg and Sox2 (bottom, n=13) co-bound coactivated genes in WT ESCs (blue) and BrgKO ESCs (red). Oct4 and Sox2 ESCs sites are from ChIP-Seq datasets from.
Figure 7
Figure 7. Opposing activity and localization of esBAF and PRC2 complexes
(A) 2D Matrices depicting the gene expression changes comparing Suz12 KO ESCs (Pasini et al., 2007) and 48hr LIF-starved ESCs for all genes (left) and STAT3 bound direct targets (right). (B) Suz12 ChIP at STAT3 binding sites of BR1 genes in WT (black) and BrgKO (grey) ESCs. Error bars = SEM of 3 biological replicates. Y-axis represents ChIP/Input ratio for each region, normalized with the ratio at the GAPDH promoter. (C) ChIP assay of PRC2 component Jarid2 at Brg-dependent STAT3 sites in BrgWT versus BrgKO (grey) ESCs. Y-axis represents ChIP/Input ratio for each region, normalized with the ratio at the GAPDH promoter. Error bars = SEM of 2 biological replicates. (D) WT ESCs were infected with control (pLKO) or 2 distinct anti-Suz12 shRNA (shSuz12_1 and shSuz12_2) expressing lentiviruses either separately or together (shSuz12_1 +2). Brg deletion was induced with 4OHT after stable knockdown of Suz12 was achieved. 72 hours post 4OHT treatment, cells of the indicated genotype were harvested for H3K27me3 ChIP assay (D), transcript levels (E), and STAT3P ChIP assay (F) at Brg-dependent STAT3 binding sites in BR1. Each point represents a distinct STAT3 target gene ortarget site.
Figure 8
Figure 8. esBAF both antagonizes and synergizes with PRC2 to promote pluripotency
esBAF antagonizes PRC2 action at LIF target genes preparing them to be activated by phospho-STAT3 entering the nucleus. In contrast, esBAF works with PRC2 to enforce the H3K27Me3 repressive mark at all 4 Hox loci and over many differentiation genes. The levels of pluripotency genes are both repressed and activated by Brg (esBAF) as indicated by the blue arrow, a context-dependent function that we have called “refinement”.

Comment in

Similar articles

Cited by

References

    1. Jaenisch R, Young R. Stem Cells, the Molecular Circuitry of Pluripotency and Nuclear Reprogramming. Cell. 2008;132:567–582. - PMC - PubMed
    1. Ho L, Crabtree GR. Chromatin remodelling during development. Nature. 2010;463:474–484. - PMC - PubMed
    1. Khavari PA, Peterson CL, Tamkun JW, Mendel DB, Crabtree GR. BRG1 contains a conserved domain of the SWI2/SNF2 family necessary for normal mitotic growth and transcription. Nature. 1993;366:170–174. - PubMed
    1. Ho L, Crabtree GR. Chromatin remodelling during development. Nature. 463:474–484. - PMC - PubMed
    1. Ho L, et al. An embryonic stem cell chromatin remodeling complex, esBAF, is essential for embryonic stem cell self-renewal and pluripotency. Proceedings of the National Academy of Sciences of the United States of America. 2009;105(16):5181–5186. - PMC - PubMed

Publication types

MeSH terms