. 2011 Jul 24;13(8):952-7.
doi: 10.1038/ncb2291.

Cytoskeletal polarity mediates localized induction of the heart progenitor lineage

Affiliations

Cytoskeletal polarity mediates localized induction of the heart progenitor lineage

James Cooley et al. Nat Cell Biol. .

Abstract

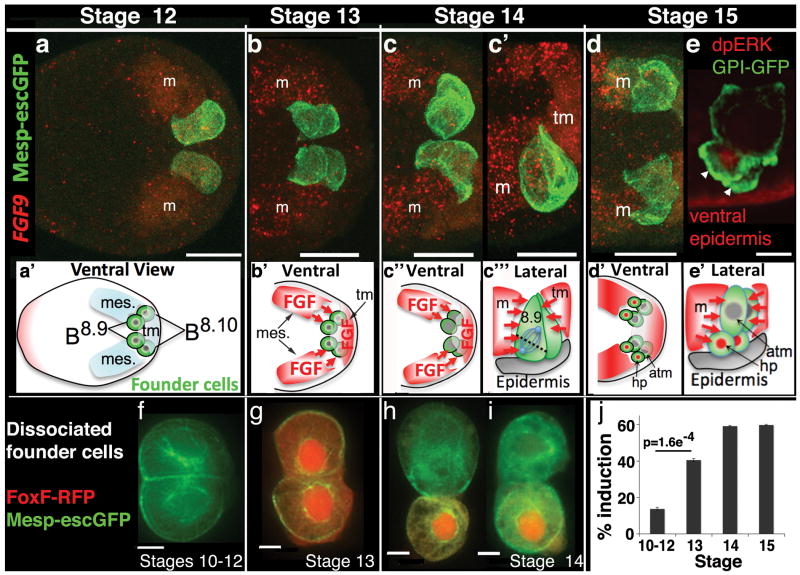
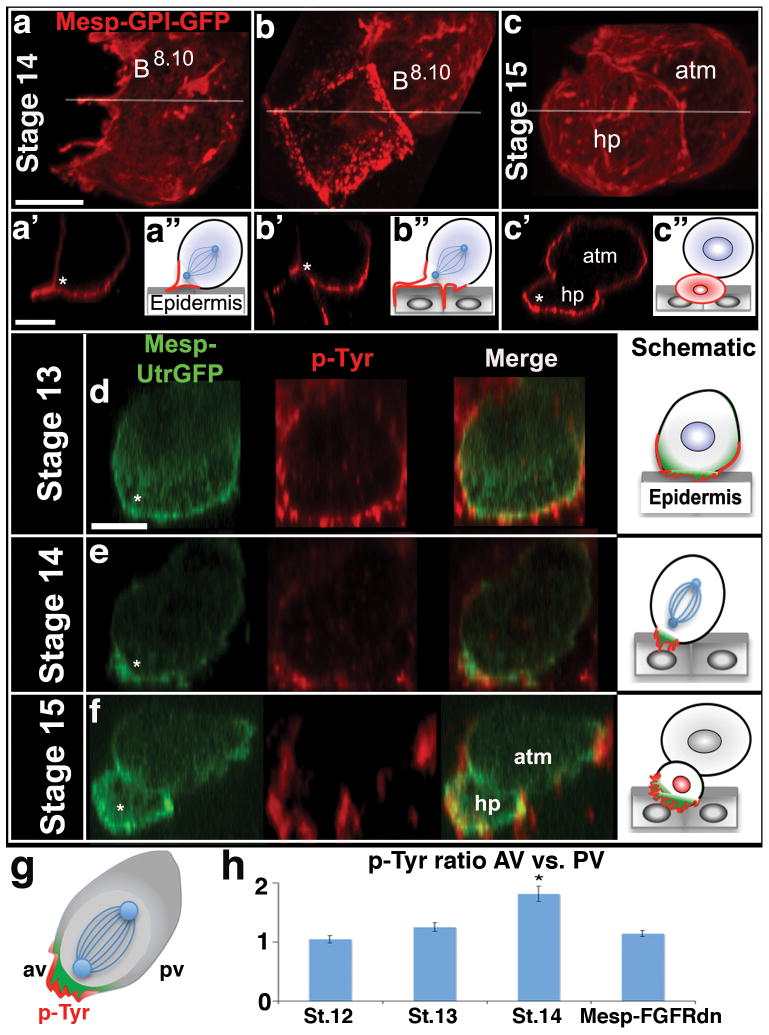
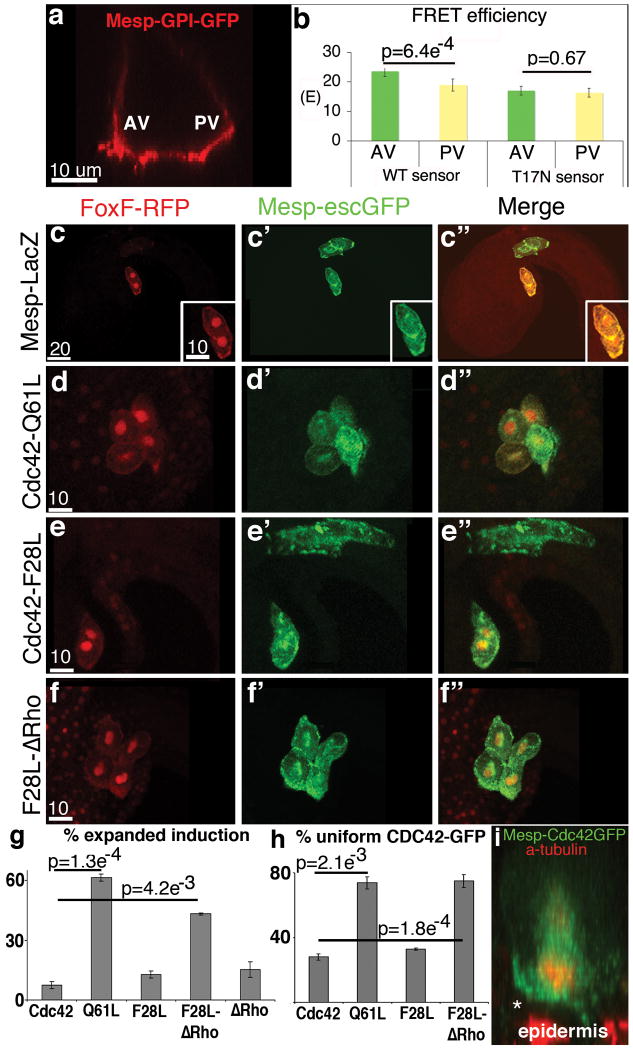
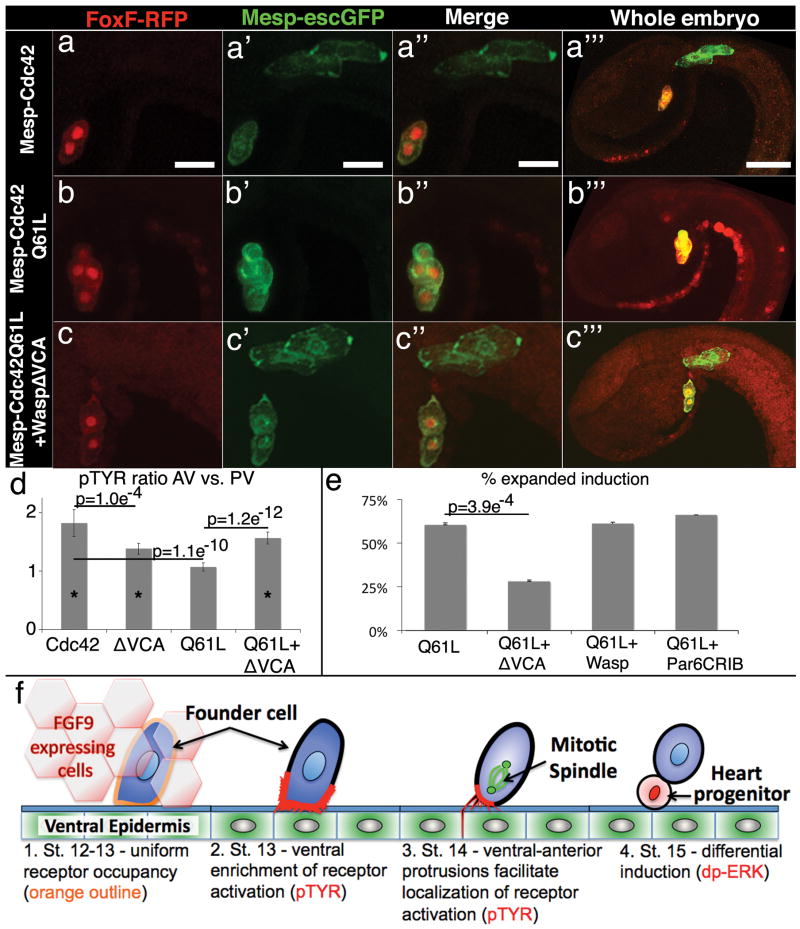
Cells must make appropriate fate decisions within a complex and dynamic environment. In vitro studies indicate that the cytoskeleton acts as an integrative platform for this environmental input. External signals regulate cytoskeletal dynamics and the cytoskeleton reciprocally modulates signal transduction. However, in vivo studies linking cytoskeleton/signalling interactions to embryonic cell fate specification remain limited. Here we show that the cytoskeleton modulates heart progenitor cell fate. Our studies focus on differential induction of heart fate in the basal chordate Ciona intestinalis. We have found that differential induction does not simply reflect differential exposure to the inductive signal. Instead, pre-cardiac cells employ polarized, invasive protrusions to localize their response to an ungraded signal. Through targeted manipulation of the cytoskeletal regulator CDC42, we are able to depolarize protrusive activity and generate uniform heart progenitor fate specification. Furthermore, we are able to restore differential induction by repolarizing protrusive activity. These findings illustrate how bi-directional interactions between intercellular signalling and the cytoskeleton can influence embryonic development. In particular, these studies highlight the potential for dynamic cytoskeletal changes to refine cell fate specification in response to crude signal gradients.


Figures

Figure 1
Figure 1. Nature and timing of heart progenitor lineage induction
(a-d) Ventral and lateral (c′) optical sections of FGF9 in situ hybridizations (m = mesenchyme, tm = tail muscle, scale bar = 30μm). (e) In vivo dpERK antibody staining indicates differential MAPK activation in the smaller heart progenitor cells (arrowheads) shortly after founder cell division, lateral view, scale bar = 10μm. (a′-e′) Below each image is a diagram illustrating the spatial relationship between founder cells (B8.9 and 8.10) and FGF9 expressing cells, (hp = heart progenitor, atm = larger sister cell lineage, mes. or m = mesenchyme). (f-i) Representative founder cell clone pairs resulting from staged dissociations, scale bar = 5μm. (j) Percent induction (FoxF-RFP positive cells) produced by founder cells isolated at discrete stages, n=1117 for St. 10-12, n=658 for St. 13, n=651 for St. 14 and n=693 for St. 15. Embryos are displayed anterior to the left in these and all subsequent figures.
Figure 2
Figure 2. Localized protrusive activity correlates with localized induction
(a-c) Ventral projections of membrane anchored-GFP (GPI-GFP) labeled founder lineage cells, Stage 14-15. (a′-c′) Lateral optical sections through corresponding stacks at the position indicated in (a-c) by white lines. (a″-c″) Diagrams illustrating invasion of underlying ventral epidermis. (d-f) Representative, lateral optical sections through staged B8.9 founder cells (d,e) and their progeny (f), green = Utr-GFP and red = pTyr for both images and accompanying schematics. Asterisks indicate the anterior-ventral position at which heart progenitor cells (hp) consistently emerge, atm = anterior tail muscle lineage. (g) Schematic of a dividing founder cell (after Fig. 2e) illustrating method for comparing p-Tyr levels between the anterior-ventral (av) and posterior-ventral (pv) membranes. (h) Quantitative analysis of membrane pTyr ratios (AV vs. PV). Note that significant pTyr polarization (asterisk) was first observed at stage 14 (St. 12 p=0.64, n=92; St. 13 p=0.21, n=89; St. 14 p=9.3E-012, n=89) and that this polarization was dependent on FGF signaling (St. 14 Mesp-FGFRdn p=0.103, n=57). Scale bars = 10μm.
Figure 3
Figure 3. Localized CDC42 activity is required for differential induction
(a) Lateral optical section of a stage 14 GPI-GFP labeled founder cell illustrating the anterior-ventral (AV) and posterior-ventral (PV) regions used to generate FRET data. (b) FRET data, n=30 for WT sensor and n=26 for T17N, the inactive T17N probe serves as a negative control. (c-f) Representative results from induction assays, fluorescent reporters and transgenic backgrounds as indicated above and to the left respectively. Red channel in (c″) was amplified to better visualize the embryo. (g-h) Quantitative data showing % of transgenic embryos displaying; (g) loss of localized induction, n=375 for Cdc42, n=466 for Q61L, n=461 for F28L, n=240 for F28L-ΔRho, and n= 250 for ΔRho and; (h) loss of polarized CDC42-GFP enrichment along the heart progenitor/ventral membrane, n=31 for Cdc42. n=31 for Q61L, n=25 for F28L, n=30 for F28L-ΔRho. (i) Lateral projection of dividing founder cell displaying enrichment of CDC42-GFP (green) along the presumptive heart progenitor membrane (asterisk). Scale bars in um as indicated.
Figure 4
Figure 4. Cytoskeletal polarity directs differential induction
(a-c) Representative results from induction assays, reporters and transgenic backgrounds as indicated above and to the left respectively, scale bar = 20μm, in (a′″-c′″) the red channel has been amplified to better visualize the whole embryo, scale bar = 40μm. (d) pTyr ratio comparing AV to PV membranes, n=25 for cdc42, n=29 for WaspΔVCA, n=28 for Q61L and n=33 for Q61L+WaspΔVCA, asterisks indicates a significant difference (p<0.005) in the AV vs. PV measurements for that sample set. (e) Quantitative data for induction assays showing % of transgenic embryos with expanded induction, n=374 for Q61L, n=266 for Q61L+WaspΔVCA, n=178 for Q61L+Wasp and n=307 for Q61L+ParCRIB; QL vs. QL+Wasp, p = 0.53, QL vs. QL+Par6CRIB, p = 0.81. (f) Four step model for differential specification of the heart progenitor lineage. 1. Ungraded exposure to growth factor leads to uniform receptor occupancy. 2. Receptor activation is enriched along the ventral membrane in association with enhanced protrusive activity. 3. As founder cells enter mitosis, localized invasive protrusions facilitate restriction of receptor activation to the ventral/anterior membrane. 4. Following division, Map Kinase pathway activation (nuclear dp-ERK) is restricted to the ventral daughter leading to differential expression of heart progenitor genes. See Supplemental Discussion for a more thorough explication of this model.

References

    1. Heisenberg CP, Solnica-Krezel L. Back and forth between cell fate specification and movement during vertebrate gastrulation. Curr Opin Genet Dev. 2008;18:311–316. - PMC - PubMed
    1. Engler AJ, Sen S, Sweeney HL, Discher DE. Matrix elasticity directs stem cell lineage specification. Cell. 2006;126:677–689. - PubMed
    1. Vicente-Manzanares M, Choi CK, Horwitz AR. Integrins in cell migration--the actin connection. J Cell Sci. 2009;122:199–206. - PMC - PubMed
    1. Paszek MJ, et al. Tensional homeostasis and the malignant phenotype. Cancer Cell. 2005;8:241–254. - PubMed
    1. Wozniak MA, Chen CS. Mechanotransduction in development: a growing role for contractility. Nat Rev Mol Cell Biol. 2009;10:34–43. - PMC - PubMed

Publication types

MeSH terms

Substances

LinkOut - more resources