. 2012 Mar 1;31(9):1196-206.
doi: 10.1038/onc.2011.301. Epub 2011 Jul 25.

A refined molecular taxonomy of breast cancer

Affiliations
Free PMC article

A refined molecular taxonomy of breast cancer

M Guedj et al. Oncogene. .
Free PMC article

Abstract

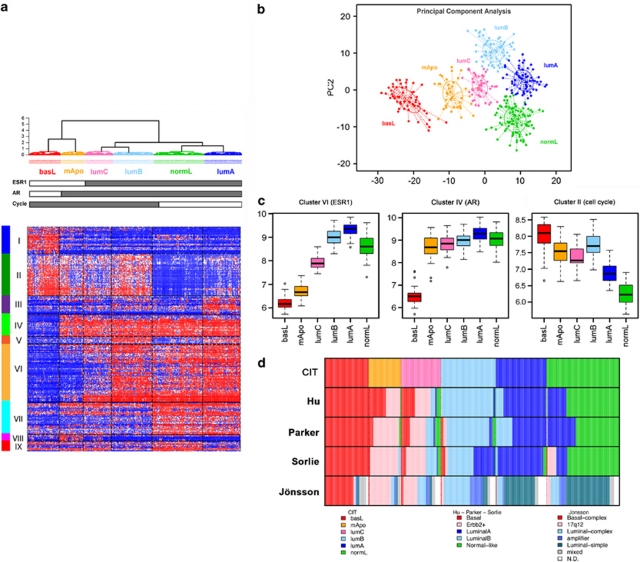
The current histoclinical breast cancer classification is simple but imprecise. Several molecular classifications of breast cancers based on expression profiling have been proposed as alternatives. However, their reliability and clinical utility have been repeatedly questioned, notably because most of them were derived from relatively small initial patient populations. We analyzed the transcriptomes of 537 breast tumors using three unsupervised classification methods. A core subset of 355 tumors was assigned to six clusters by all three methods. These six subgroups overlapped with previously defined molecular classes of breast cancer, but also showed important differences, notably the absence of an ERBB2 subgroup and the division of the large luminal ER+ group into four subgroups, two of them being highly proliferative. Of the six subgroups, four were ER+/PR+/AR+, one was ER-/PR-/AR+ and one was triple negative (AR-/ER-/PR-). ERBB2-amplified tumors were split between the ER-/PR-/AR+ subgroup and the highly proliferative ER+ LumC subgroup. Importantly, each of these six molecular subgroups showed specific copy-number alterations. Gene expression changes were correlated to specific signaling pathways. Each of these six subgroups showed very significant differences in tumor grade, metastatic sites, relapse-free survival or response to chemotherapy. All these findings were validated on large external datasets including more than 3000 tumors. Our data thus indicate that these six molecular subgroups represent well-defined clinico-biological entities of breast cancer. Their identification should facilitate the detection of novel prognostic factors or therapeutical targets in breast cancer.


Figures

Figure 1
Figure 1
Breast tumor classification according to the CIT classification into six subgroups of tumors. (a) Heatmap representing the expression of the 256 genes (nine clusters of genes represented by vertical color bars on the left of the heatmap) through the six groups. (b) Principal component analysis (PCA) of the samples of the coreset according to the 256 gene signature. The first principal component (PC1) represents the combined expression of the three transversal clusters (ER, AR and cell cycle), the second component (PC2) differentiates LumB and NormL. (c) Distribution of mean expression levels of the three transversal gene clusters (ER, AR and Cell Cycle) over the six main molecular subgroups. (d) Comparison of the CIT classification with those obtained using the Sorlie, Hu, Parker and Jönsson systems.
Figure 2
Figure 2
Breast cancer molecular subgroups show distinctly different disease outcome. Kaplan–Meier curves shown in this figure represent disease-free survival with metastatic relapse as an end point. (a, b) show survival curves in the CIT and validation set, respectively. Abrupt breaks in some curves of (a) are related to small numbers of patients with long-term follow-up in these subgroups. These appear smoothed out in (b) because of greater numbers in the validation set.
Figure 3
Figure 3
Molecular subgroups show differential activation of major signaling pathways: correlations between a given pathway and a subgroup are indicated by color boxes. Red boxes show upregulation of the pathway, green downregulation. Up or downregulation was deduced using KEGGanim tool where relative expression measures are projected in the related KEGG pathway interaction graph. Pathways showing no clear direction of regulation were excluded.
Figure 4
Figure 4
Breast cancer molecular subgroups present different copy-number change (CNC) profiles. CNC profiles were established using genome-wide array-CGH on a 488 breast tumor dataset and subsequently stratified according to the CIT classification. Panel a shows frequency of gains (vertical bars going up) or losses (bars going down) at a given location on the genome. Graphs from top to bottom correspond to profiles of the whole CIT breast cancer set and each of the six molecular subgroups. Panel b represents regions of CNC correlating to a specific subgroup. Specific genomic regions for the whole CIT set are the ones for which the proportion of alterations (in gain or loss) exceeded 20%. Subgroup-specific regions are those that present significant increase in proportion (at a 0.1 FDR level) in a given subgroup tested against all others. Bars represent P-values after a standard logarithmic transformation.
Figure 5
Figure 5
Principal component analysis (PCA) of the CIT coreset expression profiles based on a meta-signature comparing normal mammary epithelial cell subpopulations. A 163 gene signature was produced by comparing different normal mammary cell contingents from three independent studies (GSE16997, GSE18931, GSE11395) and used in a PCA. Samples from the CIT coreset (panel a) and normal mammary gland samples (panel b) from GSE16997 were projected in the two first principal components in the upper and lower panel, respectively.

References

    1. Bertheau P, Turpin E, Rickman DS, Espie M, de Reynies A, Feugeas JP, et al. Exquisite sensitivity of TP53 mutant and basal breast cancers to a dose-dense epirubicin-cyclophosphamide regimen. PLoS Med. 2007;4:e90. - PMC - PubMed
    1. Bertucci F, Finetti P, Cervera N, Maraninchi D, Viens P. Gene expression profiling and clinical outcome in breast cancer. Omics. 2006;10:429–443. - PubMed
    1. Bertucci F, Orsetti B, Negre V, Finetti P, Rouge C, Ahomadegbe JC, et al. Lobular and ductal carcinomas of the breast have distinct genomic and expression profiles. Oncogene. 2008;27:5359–5372. - PMC - PubMed
    1. Bonnefoi H, Potti A, Delorenzi M, Mauriac L, Campone M, Tubiana-Hulin M, et al. Validation of gene signatures that predict the response of breast cancer to neoadjuvant chemotherapy: a substudy of the EORTC 10994/BIG 00-01 clinical trial. Lancet Oncol. 2007;8:1071–1078. - PubMed
    1. Bos PD, Zhang XH, Nadal C, Shu W, Gomis RR, Nguyen DX, et al. Genes that mediate breast cancer metastasis to the brain. Nature. 2009;459:1005–1009. - PMC - PubMed

Publication types

Substances