. 2011:2011:751052.
doi: 10.1155/2011/751052. Epub 2011 Jul 14.

Inhalation of ortho-phthalaldehyde vapor causes respiratory sensitization in mice

Affiliations

Inhalation of ortho-phthalaldehyde vapor causes respiratory sensitization in mice

Victor J Johnson et al. J Allergy (Cairo). 2011.

Abstract

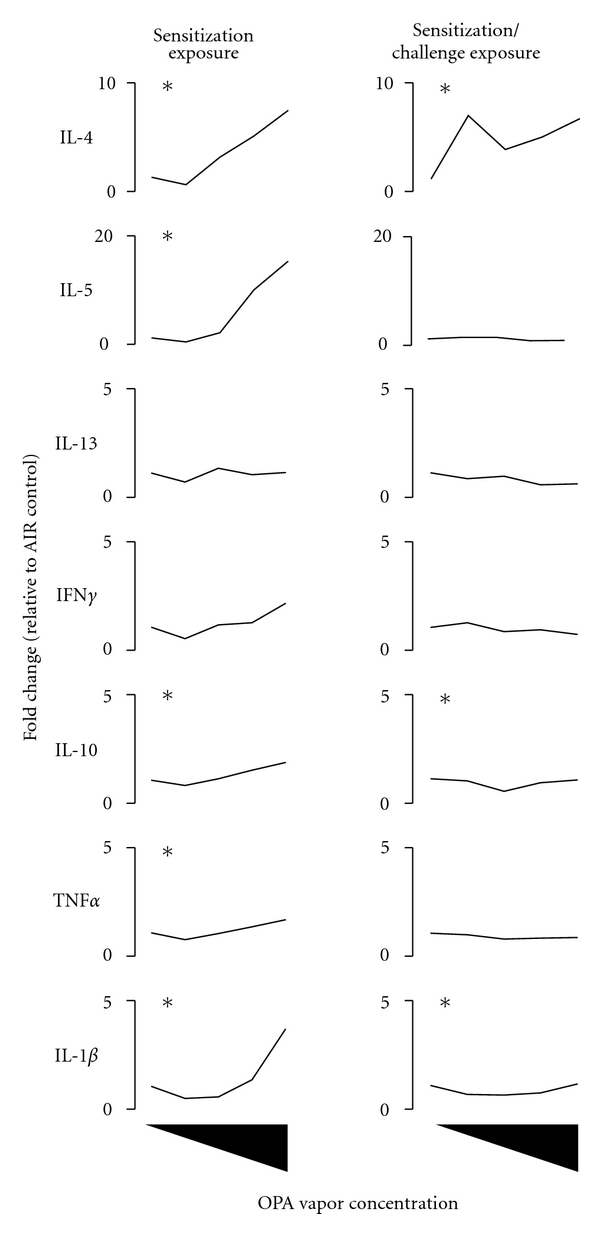
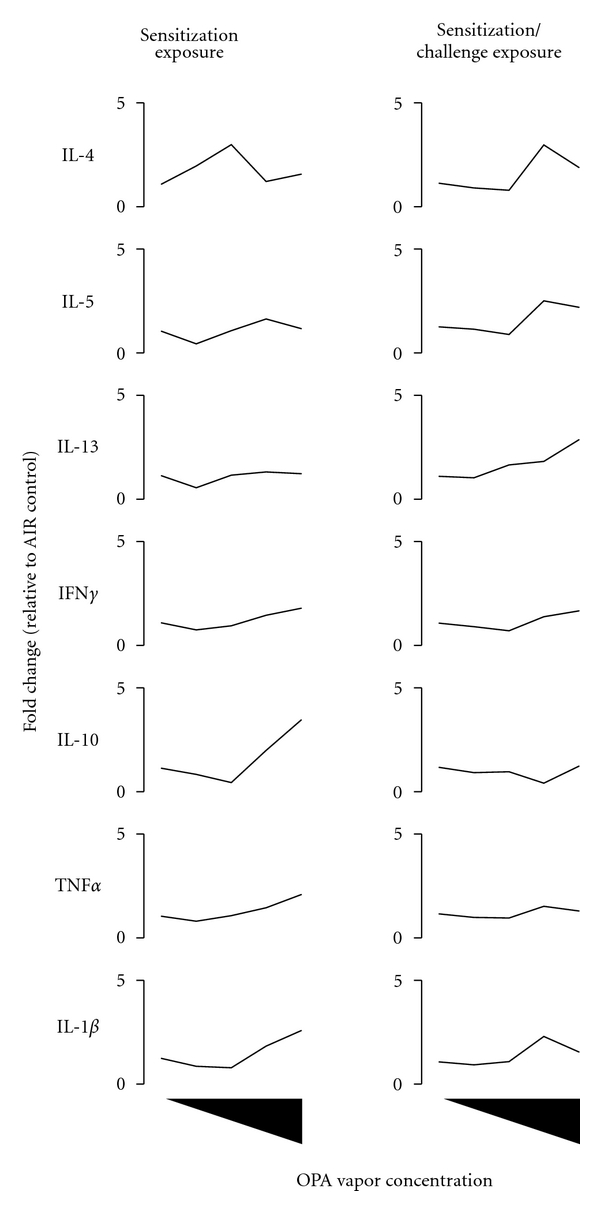
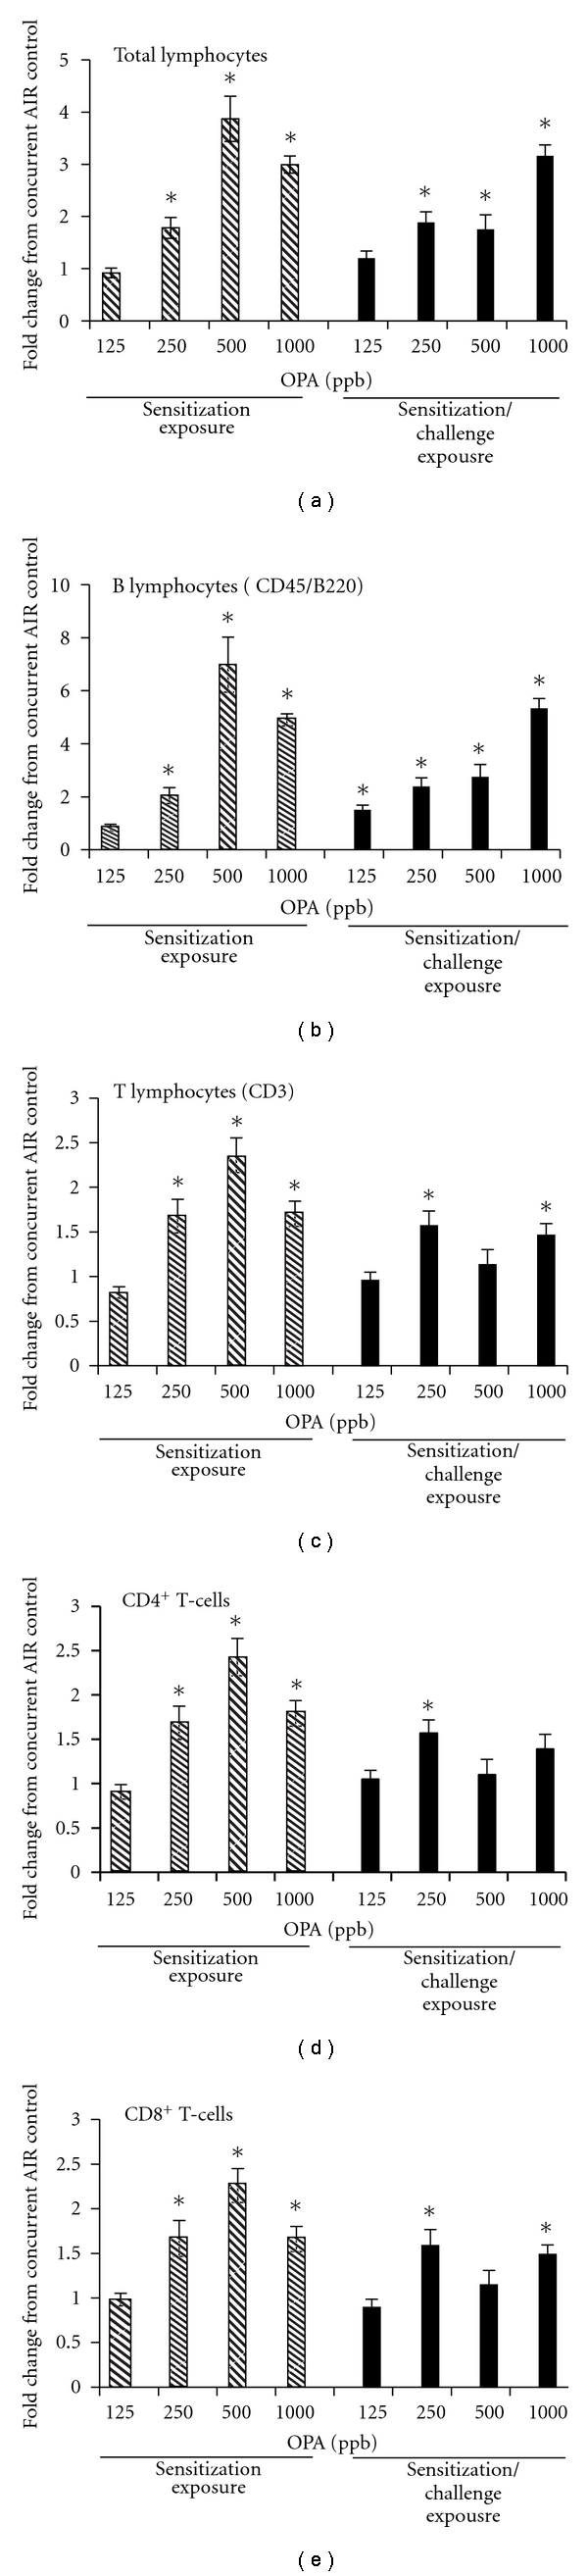
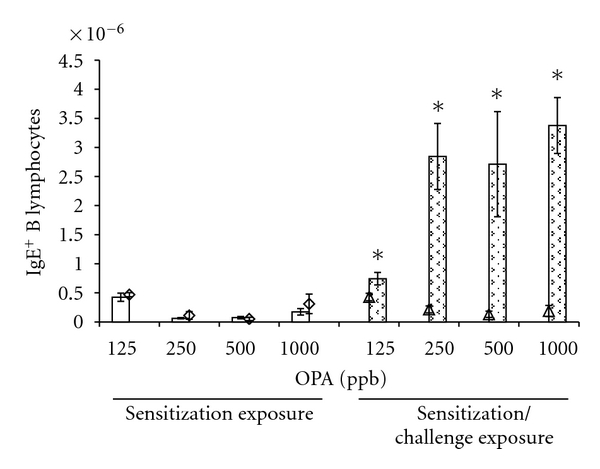
Ortho-Phthalaldehyde (OPA) has been approved for high-level sterilization of heat-sensitive medical instruments and is increasingly being used as a replacement in the healthcare industry for glutaraldehyde, a known sensitizer. Numerous case reports have been published indicating workers and patients experiencing respiratory problems, anaphylaxis, skin reactivity, and systemic antibody production. Our laboratory previously demonstrated that OPA is a dermal sensitizer in mice. The goal of the present study was to determine if OPA is a respiratory sensitizer following inhalation exposure. Mice were exposed to OPA vapor and airway and lymph nodes were examined for cytokine gene expression and alterations in lymphocyte populations. Inhalation of OPA for 3 days resulted in a concentration-dependent increase in lymphocyte proliferation, mainly B lymphocytes, in the draining lymph nodes. A secondary challenge of mice with OPA resulted in a dramatic increase in the population of B lymphocytes expressing IgE. Expression of Th2 (IL-4, IL-5, and IL-13) and anti/proinflammatory (IL-10, TNFα, and IL-1β) cytokine genes was upregulated in the lymph nodes and the nasal mucosa. Mice exposed to the higher concentrations of OPA-produced OPA-specific IgG(1) antibodies indicating systemic sensitization. These findings provide evidence that OPA has the potential to cause respiratory sensitization in mice.


Figures

Figure 1
Figure 1
OPA inhalation and sacrifice schedule.
Figure 2
Figure 2
Inhalation of OPA vapor induces the expression of Th2 and pro/anti-inflammatory cytokines in the draining lymph nodes of mice. Mice were exposed to OPA (125, 250, 500, 1000 ppb) or filtered air according to the schedule shown in Figure 1. Two days following the final exposure, the mandibular lymph nodes from the left side of the neck were removed and processed for gene expression analysis. Data are presented as mean (n = 5) and represent fold change relative to the concurrent control group. *Indicates that the cytokine was significantly increased at one or more of the OPA concentrations. Refer to Table S1 of the supplementary material available online at doi: 10.1155/2011/751052 for the empirical gene expression data.
Figure 3
Figure 3
Inhalation of OPA vapor induces the expression of Th2, Th1, and pro/anti-inflammatory cytokines in the nasal mucosa of mice. Mice were exposed to OPA (125, 250, 500, 1000 ppb) or filtered air according to the schedule shown in Figure 1. Two days following the final exposure, the mucosal tissue lining the maxilloturbinates and lateral wall of the nasal cavity were removed and processed for gene expression analysis. Data are presented as mean (n = 5) and represent fold change relative to the concurrent control group. *Indicates that the cytokine was significantly increased at one or more of the OPA concentrations. Refer to Table S1 for the empirical gene expression data.
Figure 4
Figure 4
Effect of respiratory exposure to OPA vapor on the expression of Th2, Th1, and pro/anti-inflammatory cytokines in the lungs of mice. Mice were exposed to OPA (125, 250, 500, 1000 ppb) or filtered air according to the schedule shown in Figure 1. Two days following the final exposure, the lungs were removed, inflated with RNALater, and processed for gene expression analysis. Data are presented as mean (n = 5) and represent fold change relative to the concurrent control group. *Indicates that the cytokine was significantly increased at one or more of the OPA concentrations. Refer to Table S1 for the empirical gene expression data.
Figure 5
Figure 5
OPA inhalation stimulates B- and T-lymphocyte proliferation in the draining lymph nodes of mice. Mice were exposed to OPA or filtered air according to the schedule shown in Figure 1. Two days following the final exposure, the mandibular lymph nodes from the right side of the neck were removed and immediately processed into single-cell suspensions. Scatter properties were used to identify lymphocytes followed by fluorescent antibodies labeling to identify B lymphocytes, T lymphocytes (total, CD4+ and CD8+) using flow cytometry. Data are presented as fold change relative to the concurrent control. Statistical analysis was performed on the absolute cell counts for each lymphocyte population. Hatched bars represent mice that were exposed for 3 days followed by sacrifice on day 5 (sensitization exposure, Figure 1). Solid bars represent mice that were exposed on d1–d3, d16–d18 and sacrificed on d20 (sensitization/challenge exposure, Figure 1). Mean ± SEM (n = 5). *Significantly different from concurrent control group at P < .05. Absolute cell counts are presented in Table S2.
Figure 6
Figure 6
OPA inhalation induces isotype switching in B lymphocytes to IgE. Mice were exposed to OPA or filtered air according to the schedule shown in Figure 1. Two days following the final exposure, the mandibular lymph nodes from the right side of the neck were removed and immediately processed into single-cell suspensions. Scatter properties were used to identify lymphocytes followed by fluorescent antibodies labeling to identify B lymphocytes using flow cytometry. Fluorescent anti-IgE antibodies were used to identify B-lymphocyte expressing IgE on their membrane. Open bars and open diamonds represent mice that were exposed OPA or filtered air, respectively, for 3 days followed by sacrifice on day 5 (sensitization exposure, Figure 1). Stippled bars and open triangles represent mice that were exposed OPA or filtered air, respectively, on d1–d3, d16–d18 and sacrificed on d20 (sensitization/challenge exposure, Figure 1). Mean ± SEM (n = 5). *Significantly different from concurrent control group at P < .05.

Similar articles

Cited by

References

    1. Curran AD, Burge PS, Wiley K. Clinical and immunologic evaluation of workers exposed to glutaraldehyde. Allergy. 1996;51(11):826–832. - PubMed
    1. Di Stefano F, Siriruttanapruk S, McCoach J, Burge PS. Glutaraldehyde: an occupational hazard in the hospital setting. Allergy. 1999;54(10):1105–1109. - PubMed
    1. Di Stefano F, Siriruttanapruk S, McCoach JS, Burge PS. Occupational asthma due to glutaraldehyde. Monaldi Archives for Chest Disease. 1998;53:50–55. - PubMed
    1. Gannon PF, Bright P, Campbell M, O’Hickey SP, Burge PS. Occupational asthma due to glutaraldehyde and formaldehyde in endoscopy and X ray departments. Thorax. 1995;50(2):156–159. - PMC - PubMed
    1. Maier LE, Lampel HP, Bhutani T, Jacob SE. Hand dermatitis: a focus on allergic contact dermatitis to biocides. Dermatologic Clinics. 2009;27(3):251–264. - PubMed

LinkOut - more resources