. 2011:2011:813028.
doi: 10.1155/2011/813028. Epub 2011 Jul 14.

SPECT Imaging of Epilepsy: An Overview and Comparison with F-18 FDG PET

Affiliations

SPECT Imaging of Epilepsy: An Overview and Comparison with F-18 FDG PET

Sunhee Kim et al. Int J Mol Imaging. 2011.

Abstract

Epilepsy surgery is highly effective in treating refractory epilepsy, but requires accurate presurgical localization of the epileptogenic focus. Briefly, localization of the region of seizure onset traditionally dependents on seizure semiology, scalp EEG recordings and correlation with anatomical imaging modalities such as MRI. The introduction of noninvasive functional neuroimaging methods, including single-photon emission computed tomography (SPECT) and positron emission tomography (PET) has dramatically changed the method for presurgical epilepsy evaluation. These imaging modalities have become powerful tools for the investigation of brain function and are an essential part of the evaluation of epileptic patients. Of these methods, SPECT has the practical capacity to image blood flow functional changes that occur during seizures in the routine clinical setting. In this review we present the basic principles of epilepsy SPECT and PET imaging. We discuss the properties of the SPECT tracers to be used for this purpose and imaging acquisition protocols as well as the diagnostic performance of SPECT in addition to SPECT image analysis methods. This is followed by a discussion and comparison to F-18 FDG PET acquisition and imaging analysis methods.


Figures

Figure 1
Figure 1
Transverse tomographic images from a normal 41-year-old female subject after injection of 20 mCi Tc-99m ECD. The transverse images are arranged parallel to and sequentially above the canthomeatal line, with the cerebellum at the top left and the vertex of the brain at the bottom right. The scan thickness is 4 mm. The scan resolution is approximately 7 mm full width at half maximum.
Figure 2
Figure 2
Illustration of the value of ictal SPECT in a 38-year-old male with intractable epilepsy. The MRI was normal. The Tc-99m HMPAO ictal brain SPECT scan showed a focal area of hyperperfusion in the right frontal area. In this case, the interictal scan shows normal perfusion to this area of the brain.
Figure 3
Figure 3
Tc-99m HMPAO ictal brain SPECT scan section (middle) showing a focal area of hyperperfusion in the right premotor area. The right to left asymmetry in blood flow for this region was 1.32, and the intensity of uptake in the right frontal lobe measured 1.13 (cortical to cerebellar ratio) with a range of normals = mean ± 1SD of 0.90 ± 0.07. The ictal brain SPECT scan was subsequently coregistered with the MRI scan (left). The resulting fusion image (right) shows the anatomic location of the epileptogenic focus, which was surgically excised, and the patient was rendered seizure-free.
Figure 4
Figure 4
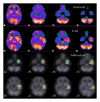
An interictal technetium-99m ECD brain SPECT scan (top) as compared with an ictal technetium-99m ECD brain SPECT scan (second row). On the ictal brain SPECT scan one can see increased hyperemia involving the left temporal lobe (third and fourth rows). Using subtraction comparison, one can see statistically significant differences between the ictal and interictal scan involving the left temporal lobe. The test for statistical significance has z values between three and four (red color = z value of 4).
Figure 5
Figure 5
Normal F-18 FDG PET image from a 56-year-old female subject at rest. PET scan image slice thickness of ~4 mm reconstructed in plane image resolution = 5 mm FWHM.
Figure 6
Figure 6
16-year-old boy with temporal lobe epilepsy and hippocampal sclerosis in the right mesial temporal lobe on MRI. (a) MRI shows abnormal high signal intensity in the right mesial temporal lobe (hippocampal region). (b) FDG PET scan shows a focal reduction of FDG uptake in the right mesial temporal lobe (hippocampal region). (c) MRI-PET fusion image illustrating that the reduction in FDG corresponds to the region of MRI increase in signal intensity.
Figure 7
Figure 7
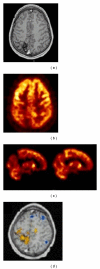
Two-year-old female with intractable partial epilepsy and developmental delay. (a) MRI is normal. (b) Focal F-18 FDG reduction in the right superior parietal lobe representing the epileptogenic focus (arrowhead). (c) MR-PET fusion image. Focal FDG reduction in the right superior parietal lobe representing the epileptogenic focus (arrowhead). (d) 3D-SSP map shows significant reduction of F-18 FDG (arrowhead). (e) Placement of intracranial electrodes guided by F-18 FDG PET is shown on skull radiograph.
Figure 8
Figure 8
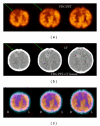
F-18 FDG PET findings in a 1-year-old boy with tuberous sclerosis. (a) FDG PET portion of PET-CT scan showed reduced metabolism in the multiple areas of the tubers, with significant reduction in the focus in the right parasagittal frontal lobe (arrow). (b) CT portion of PET-CT scan showing sclerosis in the region of the right parasagittal frontal lobe tuber (arrow). (c) PET-CT fusion image showing that the areas of decreased metabolism correspond to the prominent right parasagittal frontal lobe tuber.
Figure 9
Figure 9
42-year-old female with intractable seizures with seizure activity frequency of 1-2 brief seizures per day, felt to arise from the frontal lobe regions, but were nonlocalizing by video-EEG monitoring. (a) The MRI scan is normal. (b) The ictal Tc-99m HMPAO brain SPECT scan showed a focal area of significant hyperemia in the right mesial frontal lobe. (c) There was minimal reduction of F-18 FDG uptake in this location, but this was not specific for the identification of the epileptogenic focus.
Figure 10
Figure 10
Eleven-year-old male suffering from generalized tonic-clonic seizure disorder. (a) MRI scan of an-11-year old boy suffering from seizure disorder since the age of 7. The patient has tonic-clonic seizures. The MRI scan shows an arterial venous malformation in the right parietal lobe. (b) The interictal brain F-18 FDG PET scan shows an area of reduced metabolic activity in the right parietal lobe consistent with the location of the arterial venous malformation. (c) Images from an interictal Tc-99m ECD brain SPECT (top) as compared to an ictal technetium-99m ECD brain SPECT scan (bottom). One can see significant hyperemia anterior and inferior to the region of the arterial venous malformation on the ictal Tc-99m ECD brain SPECT scan as compared to the interictal brain SPECT scan. (d) SISCOM analysis where the ictal and interictal SPECT are compared and statistically significant differences between the two are mapped onto the patient's MRI scan. One can see significantly increased differences in the ictal study as compared to the interictal study in the anterior region and in the location of the arterial venous malformation (highlighted yellow areas). The highlighted blue area shows areas of decreased uptake on the ictal scan as compared to the interictal scan, which can generally be seen positioned randomly throughout the cortex and do not have clinical or localizing significance.

Similar articles

Cited by

References

    1. Engel J., Jr. Outcome with respect to epileptic seizures. In: Engel J Jr., editor. Surgical Treatment of the Epilepsies. New York, NY, USA: Raven Press; 1987. pp. 553–571.
    1. Holman BL, Devous MD. Functional brain SPECT: the emergence of a powerful clinical method. Journal of Nuclear Medicine. 1992;33(10):1888–1904. - PubMed
    1. Lassen NA, Blasberg RG. Technetium-99m-d,l-HM-PAO, the development of a new class of Tc-labeled tracers: an overview. Journal of Cerebral Blood Flow and Metabolism. 1988;8(6):S1–S3. - PubMed
    1. Walovitch RC, Hill TC, Garrity ST, et al. Characterization of technetium-99m-L,L-ECD for brain perfusion imaging, part 1: pharmacology of technetium-99m ECD in nonhuman primates. Journal of Nuclear Medicine. 1989;30(11):1892–1901. - PubMed
    1. Deutsch G, Mountz JM. Neuroimaging evidence of diaschisis and reorganization in stroke recovery. In: Christensen AL, Uzzell B, editors. International Handbook of Neuropsychological Rehabilitation. New York, NY, USA: Plenum; 2000. pp. 33–63.

LinkOut - more resources