. 2011 Jul;130(1):273-82.
doi: 10.1121/1.3596463.

On the mechanisms involved in the recovery of envelope information from temporal fine structure

Affiliations

On the mechanisms involved in the recovery of envelope information from temporal fine structure

Frédéric Apoux et al. J Acoust Soc Am. 2011 Jul.

Abstract

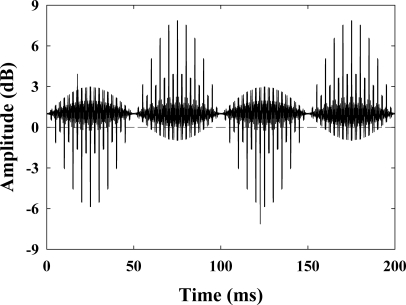
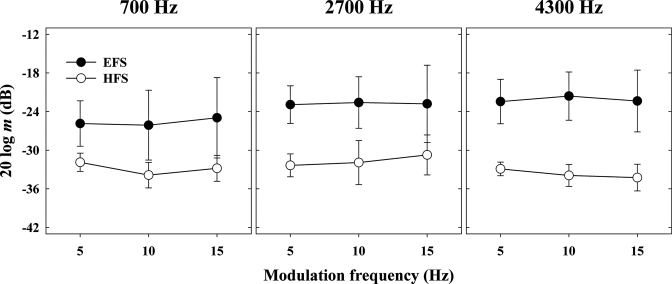
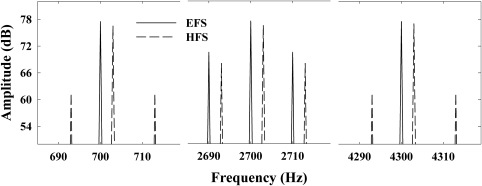
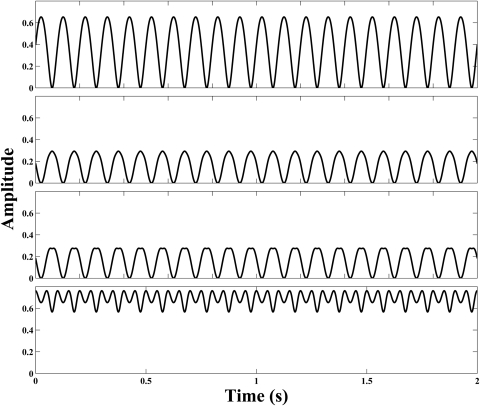
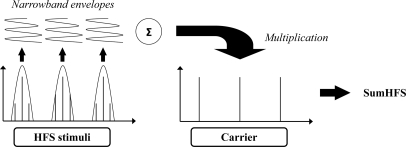
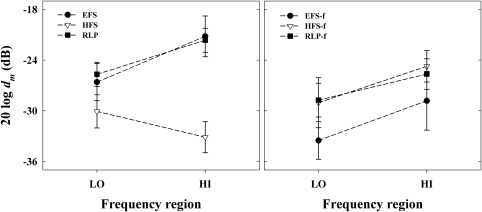
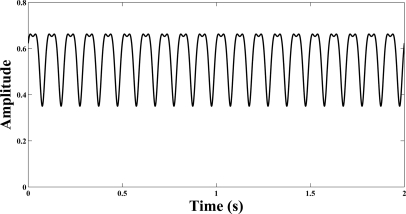
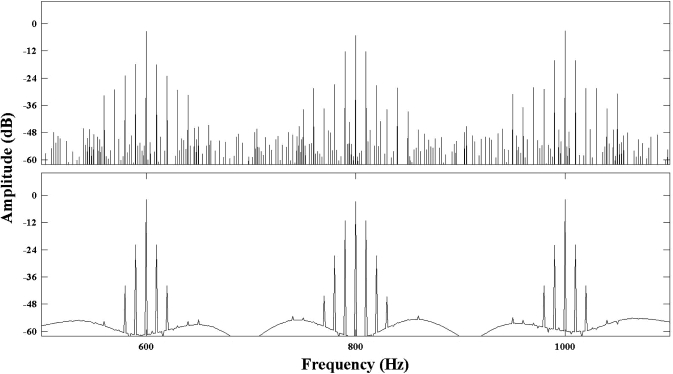
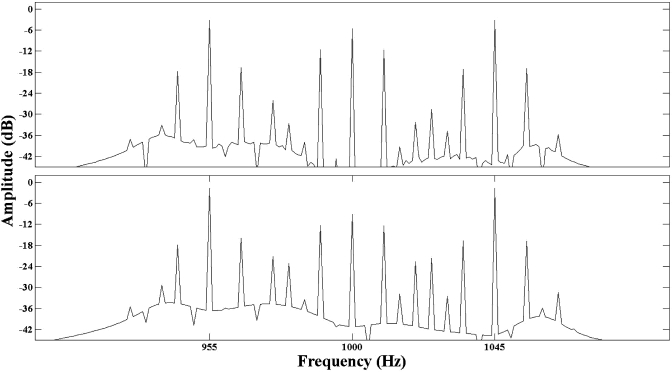
Three experiments were designed to provide psychophysical evidence for the existence of envelope information in the temporal fine structure (TFS) of stimuli that were originally amplitude modulated (AM). The original stimuli typically consisted of the sum of a sinusoidally AM tone and two unmodulated tones so that the envelope and TFS could be determined a priori. Experiment 1 showed that normal-hearing listeners not only perceive AM when presented with the Hilbert fine structure alone but AM detection thresholds are lower than those observed when presenting the original stimuli. Based on our analysis, envelope recovery resulted from the failure of the decomposition process to remove the spectral components related to the original envelope from the TFS and the introduction of spectral components related to the original envelope, suggesting that frequency- to amplitude-modulation conversion is not necessary to recover envelope information from TFS. Experiment 2 suggested that these spectral components interact in such a way that envelope fluctuations are minimized in the broadband TFS. Experiment 3 demonstrated that the modulation depth at the original carrier frequency is only slightly reduced compared to the depth of the original modulator. It also indicated that envelope recovery is not specific to the Hilbert decomposition.


Figures

Figure 1
Figure 1
Example of the “true” envelope of the stimuli used in experiment 1b. The original stimulus was created by adding together three sinusoids with frequencies 700, 2700, and 4300 Hz. The 2700-Hz sinusoid was sinusoidally amplitude modulated at 10 Hz with dm = 0.9 before adding the other sinusoids. The envelope was obtained by dividing the signal by itself with the modulation depth, dm, set to 0.
Figure 2
Figure 2
Averaged modulation detection thresholds as a function of the modulation frequency. Each panel corresponds to results when a given carrier frequency was the modulated carrier. The circles and squares correspond to the EFS and the HFS condition, respectively. Errors bars indicate ± one standard deviation.
Figure 3
Figure 3
Partial representation of the amplitude spectra of the stimuli used in experiment 1b. The original stimulus consisted of the sum of three sinusoids with the middle component modulated at 10 Hz with dm = 0.9 prior to adding. The two components at 700 and 4300 Hz were unmodulated. For clarity, the spectrum of the HFS stimulus has been shifted toward higher frequencies by 3 Hz.
Figure 4
Figure 4
Example narrow-band envelopes of a stimulus from the Hilbert fine structure condition. The original stimulus is the same as in Fig. 3. Successively lower panels show envelopes extracted from the output of a 128-Hz band-pass filter centered at 2700, 700, and 4300 Hz, respectively. The lowest panel shows sum of the three envelopes.
Figure 5
Figure 5
Schematic of the processing used to create the SumHFS stimuli.
Figure 6
Figure 6
Averaged modulation detection thresholds as a function of the frequency region of the carriers. Left panel shows the thresholds for unfiltered stimuli. Right panel shows the thresholds for the same stimuli filtered using a 128-Hz band-pass filter centered at the original modulated carrier.
Figure 7
Figure 7
Sum of three narrow-band envelopes extracted from the output of a 128-Hz band-pass filter centered at 646, 2700, and 4346 Hz, respectively. The original stimulus is the same as in Fig. 4.
Figure 8
Figure 8
Example of amplitude spectra of TFS stimuli used in experiment 3. The original stimulus consisted of the sum of three sinusoids with the 800-Hz component modulated at 10 Hz with dm = 0.9 prior to adding. The two components at 600 and 1000 Hz were unmodulated. The TFS was obtained using the Hilbert (upper panel) or the RLP (lower panel) technique.
Figure 9
Figure 9
Amplitude spectra of a TFS stimulus. The original stimulus consisted of the sum of three sinusoids with the 1000-Hz component modulated at 10 Hz with dm = 0.9 prior to adding. The two components at 955 and 1045 Hz were unmodulated. The upper panel corresponds to a TFS obtained using the Hilbert approach. The lower panel corresponds to a TFS obtained using the RLP approach. Both approaches to TFS estimation were computed at the output of a 132-Hz (i.e., 1-ERBN) band-pass filter centered at 1000 Hz.

References

    1. ANSI (2004). S3.6-2004, Specifications for Audiometers (American National Standards Institute, New York: ).
    1. Apoux, F., and Bacon, S. P. (2004). “Relative importance of temporal information in various frequency regions for consonant identification in quiet and in noise,” J. Acoust. Soc. Am. 116, 1671–1680. 10.1121/1.1781329 - DOI - PubMed
    1. Apoux, F., and Bacon, S. P. (2008). “Differential contribution of envelope fluctuations across frequency to consonant identification in quiet,” J. Acoust. Soc. Am. 123, 2792–2800. 10.1121/1.2897916 - DOI - PMC - PubMed
    1. Atlas, L., Li, Q., and Thompson, J. (2004). “Homomorphic modulation spectra,” Proceedings of IEEE ICASSP, pp. 761–764.
    1. van den Brink, W. A. C., and Houtgast, T. (1990a). “Efficient acrossfrequency integration in short-signal detection,” J. Acoust. Soc. Am. 87, 284–291. 10.1121/1.399295 - DOI - PubMed

Publication types