

Quantitative determination of morphological and territorial structures of articular cartilage from both perpendicular and parallel sections by polarized light microscopy
- PMID: 21787136
- PMCID: PMC3674864
- DOI: 10.3109/03008207.2011.595521
Quantitative determination of morphological and territorial structures of articular cartilage from both perpendicular and parallel sections by polarized light microscopy
Abstract
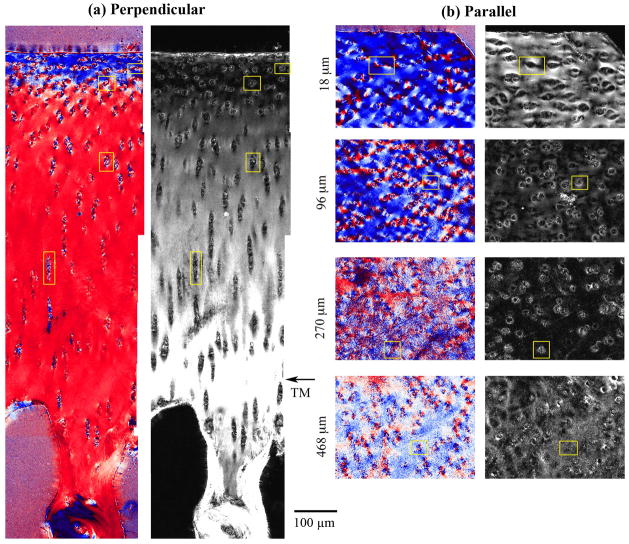
In order to investigate the three-dimensional structure of the collagen fibrils in articular cartilage, full-thickness canine humeral cartilage was microtomed into perpendicular sections that included both the articular surface and the subchondral bone and approximately 100 successive parallel sections that were each 6 microm thick and from a different cartilage depth. Each section was imaged using polarized light microscopy with a 5x objective (2.0 microm pixel size), generating two quantitative images (angle and retardation). Selected sections were also imaged using a 40x objective (0.25 microm pixel size). At an increased depth from the articular surface, the angle and retardation results in the perpendicular sections showed the well-known 90 degrees change in fibril orientation between the surface and the deep cartilage. In contrast, the retardation results of the parallel sections decreased from the articular surface and remained approximately 0 through most of the radial zones, while the angle results of the parallel sections only changed about 30 degrees. The territorial matrix morphology surrounding 61 chondrocyte clusters was quantified by its length, aspect ratio, and orientation. The cellular clusters in the surface cartilage were ellipsoidal in both parallel and perpendicular sections. In the radial zone, the cellular clusters were oriented in vertical columns in the perpendicular sections and as circular groupings in the parallel sections. This orthogonal imaging technique could provide a better understanding of the three-dimensional territorial and interterritorial fibrils in articular cartilage, the disturbance of which could signify the onset of degenerative cartilage diseases such as osteoarthritis.
Figures


Similar articles
-
Morphological changes in articular cartilage due to static compression: polarized light microscopy study.Connect Tissue Res. 2007;48(2):76-84. doi: 10.1080/03008200601130950. Connect Tissue Res. 2007. PMID: 17453909
-
Depth-dependent anisotropies of amides and sugar in perpendicular and parallel sections of articular cartilage by Fourier transform infrared imaging.Microsc Res Tech. 2011 Feb;74(2):122-32. doi: 10.1002/jemt.20881. Microsc Res Tech. 2011. PMID: 21274999 Free PMC article.
-
The collagenous architecture of articular cartilage. Correlation of scanning electron microscopy and polarized light microscopy observations.Clin Orthop Relat Res. 1979 Mar-Apr;(139):267-75. Clin Orthop Relat Res. 1979. PMID: 455843
-
Averaged and depth-dependent anisotropy of articular cartilage by microscopic imaging.Semin Arthritis Rheum. 2008 Apr;37(5):317-27. doi: 10.1016/j.semarthrit.2007.07.001. Epub 2007 Sep 21. Semin Arthritis Rheum. 2008. PMID: 17888496 Review.
-
Relationship among biomechanical, biochemical, and cellular changes associated with osteoarthritis.Crit Rev Biomed Eng. 2001;29(4):373-91. doi: 10.1615/critrevbiomedeng.v29.i4.10. Crit Rev Biomed Eng. 2001. PMID: 11822479 Review.
Cited by
-
Quantitative zonal differentiation of articular cartilage by microscopic magnetic resonance imaging, polarized light microscopy, and Fourier-transform infrared imaging.Microsc Res Tech. 2013 Jun;76(6):625-32. doi: 10.1002/jemt.22209. Epub 2013 Mar 27. Microsc Res Tech. 2013. PMID: 23533143 Free PMC article.
-
Structure and function of the septum nasi and the underlying tension chord in crocodylians.J Anat. 2016 Jan;228(1):113-24. doi: 10.1111/joa.12404. Epub 2015 Nov 10. J Anat. 2016. PMID: 26552989 Free PMC article.
-
What can biophotonics tell us about the 3D microstructure of articular cartilage?Quant Imaging Med Surg. 2015 Feb;5(1):143-58. doi: 10.3978/j.issn.2223-4292.2014.12.03. Quant Imaging Med Surg. 2015. PMID: 25694964 Free PMC article. Review.
-
Topographical and depth-dependent glycosaminoglycan concentration in canine medial tibial cartilage 3 weeks after anterior cruciate ligament transection surgery-a microscopic imaging study.Quant Imaging Med Surg. 2016 Dec;6(6):648-660. doi: 10.21037/qims.2016.06.12. Quant Imaging Med Surg. 2016. PMID: 28090443 Free PMC article.
-
Composition, structure and tensile biomechanical properties of equine articular cartilage during growth and maturation.Sci Rep. 2018 Jul 27;8(1):11357. doi: 10.1038/s41598-018-29655-5. Sci Rep. 2018. PMID: 30054498 Free PMC article.
References
-
- Benninghoff A. Form und bau der gelenkknorpel in ihren beziehungen zur funktion. II der aufbau des gelenk-knorpels in semen beziehungen zur funktion. Z Zellforsch U Mikr Anat (Berlin) 1925;2:783–862.
-
- Burton-Wurster N, Todhunter RJ, Lust G. Animal models of osteoarthritis. In: Woessner JFJ, Howell D, editors. Joint cartilage degradation. Basic and clinical aspects. New York: Marcel Dekker, Inc; 1993. pp. 347–384.
Publication types
MeSH terms
Grants and funding
LinkOut - more resources
Full Text Sources