

Strength and tempo of selection revealed in viral gene genealogies
- PMID: 21787390
- PMCID: PMC3199772
- DOI: 10.1186/1471-2148-11-220
Strength and tempo of selection revealed in viral gene genealogies
Abstract
Background: RNA viruses evolve extremely quickly, allowing them to rapidly adapt to new environmental conditions. Viral pathogens, such as influenza virus, exploit this capacity for evolutionary change to persist within the human population despite substantial immune pressure. Understanding the process of adaptation in these viral systems is essential to our efforts to combat infectious disease.
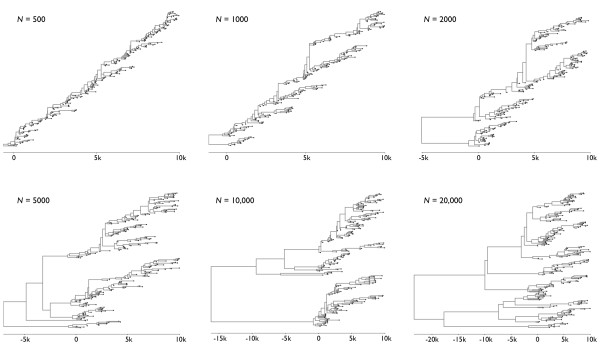
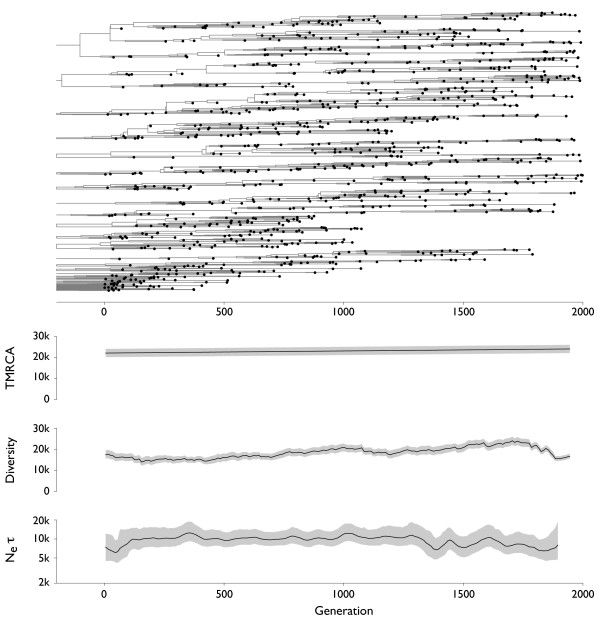
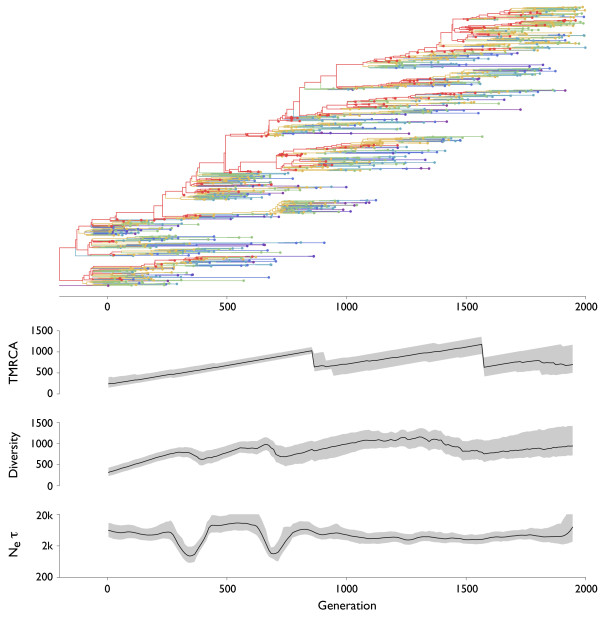
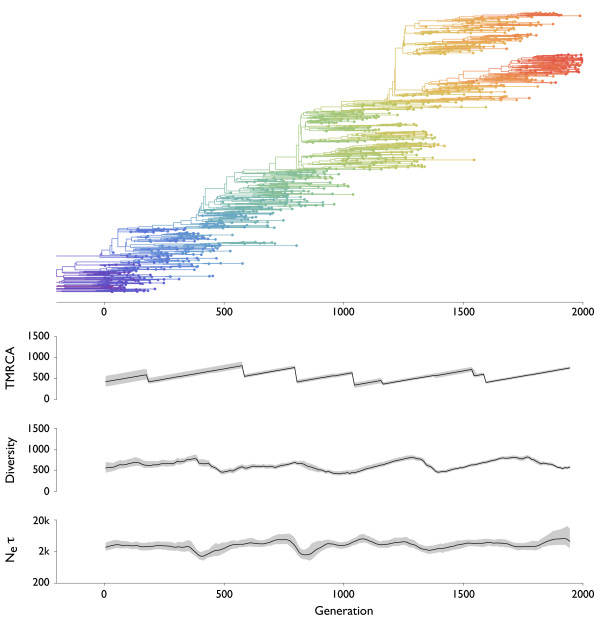
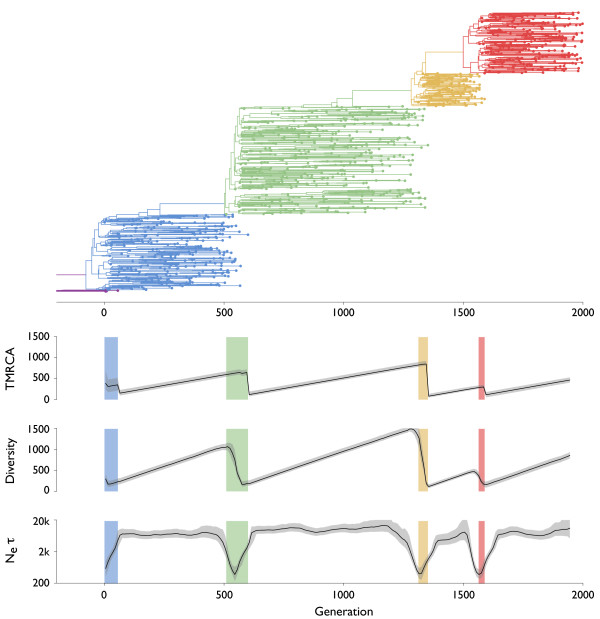
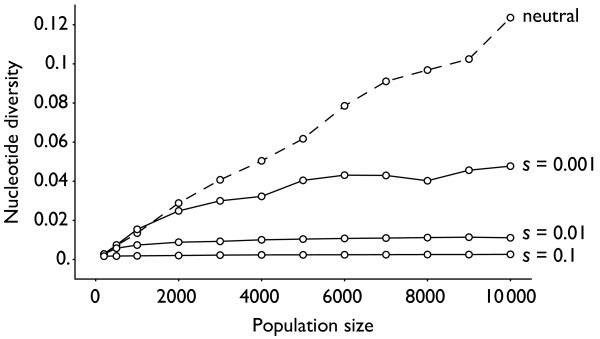
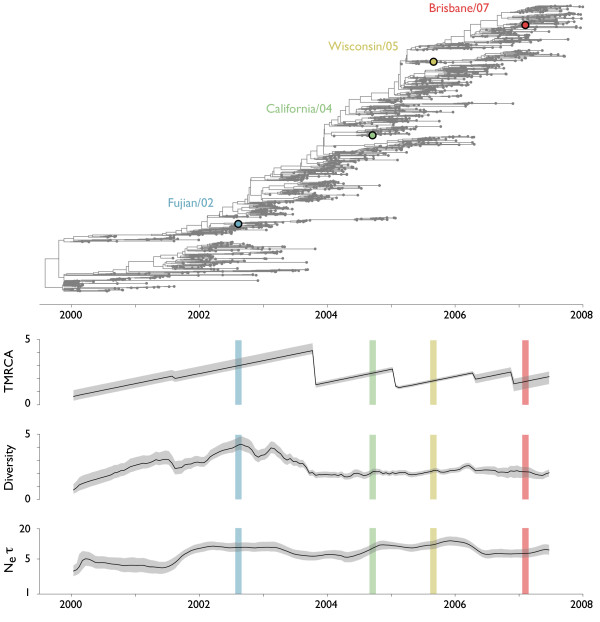
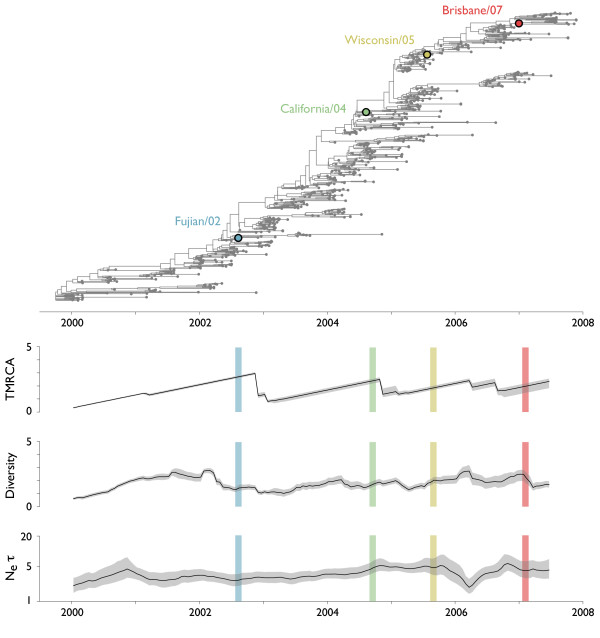
Results: Through analysis of simulated populations and sequence data from influenza A (H3N2) and measles virus, we show how phylogenetic and population genetic techniques can be used to assess the strength and temporal pattern of adaptive evolution. The action of natural selection affects the shape of the genealogical tree connecting members of an evolving population, causing deviations from the neutral expectation. The magnitude and distribution of these deviations lends insight into the historical pattern of evolution and adaptation in the viral population. We quantify the degree of ongoing adaptation in influenza and measles virus through comparison of census population size and effective population size inferred from genealogical patterns, finding a 60-fold greater deviation in influenza than in measles. We also examine the tempo of adaptation in influenza, finding evidence for both continuous and episodic change.
Conclusions: Our results have important consequences for understanding the epidemiological and evolutionary dynamics of the influenza virus. Additionally, these general techniques may prove useful to assess the strength and pattern of adaptive evolution in a variety of evolving systems. They are especially powerful when assessing selection in fast-evolving populations, where temporal patterns become highly visible.
Figures

Similar articles
-
Population genetic processes affecting the mode of selective sweeps and effective population size in influenza virus H3N2.BMC Evol Biol. 2016 Aug 3;16:156. doi: 10.1186/s12862-016-0727-8. BMC Evol Biol. 2016. PMID: 27487769 Free PMC article.
-
Intrahost dynamics of antiviral resistance in influenza A virus reflect complex patterns of segment linkage, reassortment, and natural selection.mBio. 2015 Apr 7;6(2):e02464-14. doi: 10.1128/mBio.02464-14. mBio. 2015. PMID: 25852163 Free PMC article.
-
Origins and Evolutionary Dynamics of H3N2 Canine Influenza Virus.J Virol. 2015 May;89(10):5406-18. doi: 10.1128/JVI.03395-14. Epub 2015 Mar 4. J Virol. 2015. PMID: 25740996 Free PMC article.
-
Genetic evolution of the neuraminidase of influenza A (H3N2) viruses from 1968 to 2009 and its correspondence to haemagglutinin evolution.J Gen Virol. 2012 Sep;93(Pt 9):1996-2007. doi: 10.1099/vir.0.043059-0. Epub 2012 Jun 20. J Gen Virol. 2012. PMID: 22718569 Free PMC article.
-
Implications of segment mismatch for influenza A virus evolution.J Gen Virol. 2018 Jan;99(1):3-16. doi: 10.1099/jgv.0.000989. Epub 2017 Dec 15. J Gen Virol. 2018. PMID: 29244017 Free PMC article. Review.
Cited by
-
Molecular Epidemiology and Evolution of Influenza Viruses Circulating within European Swine between 2009 and 2013.J Virol. 2015 Oct;89(19):9920-31. doi: 10.1128/JVI.00840-15. Epub 2015 Jul 22. J Virol. 2015. PMID: 26202246 Free PMC article.
-
Population genetic processes affecting the mode of selective sweeps and effective population size in influenza virus H3N2.BMC Evol Biol. 2016 Aug 3;16:156. doi: 10.1186/s12862-016-0727-8. BMC Evol Biol. 2016. PMID: 27487769 Free PMC article.
-
Complexities of Viral Mutation Rates.J Virol. 2018 Jun 29;92(14):e01031-17. doi: 10.1128/JVI.01031-17. Print 2018 Jul 15. J Virol. 2018. PMID: 29720522 Free PMC article. Review.
-
Genome-wide evolutionary dynamics of influenza B viruses on a global scale.PLoS Pathog. 2017 Dec 28;13(12):e1006749. doi: 10.1371/journal.ppat.1006749. eCollection 2017 Dec. PLoS Pathog. 2017. PMID: 29284042 Free PMC article.
-
Canalization of the evolutionary trajectory of the human influenza virus.BMC Biol. 2012 Apr 30;10:38. doi: 10.1186/1741-7007-10-38. BMC Biol. 2012. PMID: 22546494 Free PMC article.
References
-
- Duffy S, Shackelton LA, Holmes EC. Rates of evolutionary change in viruses: patterns and determinants. Nat Rev Genet. 2008;9(4):267–76. - PubMed
-
- Bush R, Fitch W, Bender C, Cox N. Positive selection on the H3 hemagglutinin gene of human influenza virus A. Mol Biol Evol. 1999;16(11):1457–1465. - PubMed
Publication types
MeSH terms
Substances
Grants and funding
LinkOut - more resources
Full Text Sources
