. 2012 Feb;22(2):307-21.
doi: 10.1101/gr.118919.110. Epub 2011 Jul 25.

Acetylation of H2A.Z is a key epigenetic modification associated with gene deregulation and epigenetic remodeling in cancer

Affiliations

Acetylation of H2A.Z is a key epigenetic modification associated with gene deregulation and epigenetic remodeling in cancer

Fátima Valdés-Mora et al. Genome Res. 2012 Feb.

Abstract

Histone H2A.Z (H2A.Z) is an evolutionarily conserved H2A variant implicated in the regulation of gene expression; however, its role in transcriptional deregulation in cancer remains poorly understood. Using genome-wide studies, we investigated the role of promoter-associated H2A.Z and acetylated H2A.Z (acH2A.Z) in gene deregulation and its relationship with DNA methylation and H3K27me3 in prostate cancer. Our results reconcile the conflicting reports of positive and negative roles for histone H2A.Z and gene expression states. We find that H2A.Z is enriched in a bimodal distribution at nucleosomes, surrounding the transcription start sites (TSSs) of both active and poised gene promoters. In addition, H2A.Z spreads across the entire promoter of inactive genes in a deacetylated state. In contrast, acH2A.Z is only localized at the TSSs of active genes. Gene deregulation in cancer is also associated with a reorganization of acH2A.Z and H2A.Z nucleosome occupancy across the promoter region and TSS of genes. Notably, in cancer cells we find that a gain of acH2A.Z at the TSS occurs with an overall decrease of H2A.Z levels, in concert with oncogene activation. Furthermore, deacetylation of H2A.Z at TSSs is increased with silencing of tumor suppressor genes. We also demonstrate that acH2A.Z anti-correlates with promoter H3K27me3 and DNA methylation. We show for the first time, that acetylation of H2A.Z is a key modification associated with gene activity in normal cells and epigenetic gene deregulation in tumorigenesis.


Figures

Figure 1.
Figure 1.
Correlation between gene expression and H2A.Z, H2A, acH2A.Z promoter occupancy in PrEC cells. Heatmaps (left) showing levels of H2A.Z (A), H2A (B), acH2A.Z (C), and acH2A.Z/H2A.Z (D) across gene promoters according to gene expression in PrEC. The x-axis represents promoter coordinates (−7500 bp to +2450 bp), where 0 is the transcriptional start site (TSS). Each row of the y-axis represents the average H2A.Z (A), H2A (B), acH2A.Z (C), and acH2A.Z/H2A.Z (D) signal intensity of 500 genes ordered according to gene expression levels (right), using robust multichip analysis (RMA). Antibody signal intensity (using MAT normalization) is represented from blue (low signal) to red (high signal). AcH2A.Z/H2A.Z represents acH2A.Z normalized with H2A.Z total levels. Black dotted lines demark genes either inactive (RMA < 4.5, 25% of the genes), or transcribed, either at basal levels (RMA 4.5–6, 25%) or medium or high levels (RMA > 6, 50%). Line plots (right) for H2A.Z (A), H2A (B), acH2A.Z (C), and acH2A.Z/H2A.Z (D) show enrichment in PrEC according to different levels of expression. Gene expression levels were split in groups of 2500 genes (blue for low expressed genes; green to red for high expressed genes). The average signal of the specific group was plotted along the gene promoter.
Figure 2.
Figure 2.
H2A.Z, H2A, and acH2A.Z occupancy changes with gene deregulation in prostate cancer. Heatmaps (left) and line plots (right) for H2A.Z (A), H2A (B), acH2A.Z (C), and acH2A.Z/H2A.Z (D) were made according to changes in gene expression in LNCaP relative to PrEC (LNCaP-PrEC), represented as a moderated t-statistics (T-stats), to study nucleosome occupancy with changes in gene expression. For heatmaps, genes were sorted into groups of 500 genes, according to changes in gene expression in LNCaP-PrEC, from down-regulated (bottom) to up-regulated (top). The color scale represents changes in signal intensity of each antibody (using a two-sided t-test), between LNCaP and PrEC from blue (loss of signal) to red (gain of signal). For line plots, groups of 2500 genes were generated according to changes in gene expression in LNCaP-PrEC. The y-axis represents the average change in each antibody between LNCaP and PrEC. Line colors are as described for Figure 1.
Figure 3.
Figure 3.
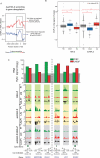
Opposing changes in H2A.Z and acH2A.Z occupancy is a potential mechanism of transcriptional (de)regulation. (A) Line plots of acH2A.Z/H2A.Z changes in LNCaP compared to PrEC. Top 25% up-regulated genes (red line) and top 25% down-regulated genes (blue line), across the promoter region, −2000 bp to +1500 bp highlighted in hatched boxes. “Up”: top up-regulated genes show a gain of acH2A.Z /H2A.Z. “Down”: top down-regulated genes show a loss of acH2A.Z/H2A.Z. (B) Box plots display the significance of change between H2A.Z and acH2A.Z levels. y-axis: distributions of t-statistics (H2A.Z and acH2A.Z) with change in expression. x-axis: “NC” (no change in expression, gray boxes); “Down” (down-regulated genes, blue boxes); “Up” (up-regulated genes, red boxes). The P-values of significance of differences between box plots were obtained with the limma function geneSetTest where (*) means a P-value of <0.05. (C) (Top) Microarray hybridization signals for mRNA expression levels in LNCaP (red) and PrEC (green) of three representative oncogenes from Table 1 (left), and three tumor suppressor genes (TSG) from Table 2 (right). Gray background highlights signals below detection (<5.0). UCSC Genome Browser tracks (bottom) for H2A.Z (green background), acH2A.Z (yellow background), and acH2A.Z/H2A.Z (gray background). Enrichment over input status and differential pattern shown. Pr (green tracks): PrEC; LN (red tracks): LNCaP; LN-Pr (black tracks): LNCaP minus PrEC. TSS for each gene shown as an arrow, genomic coordinates are indicated and CpG islands are depicted by green boxes. The scale of UCSC tracks is represented as the distance in kilobases (kb) upstream of “−” and downstream from “+“ the TSS.
Figure 4.
Figure 4.
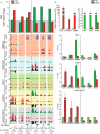
Prostate cancer–related gene deregulation shows opposite acH2A.Z/H2A.Z promoter enrichment profiles. (A) Microarray hybridization signals for mRNA expression levels in LNCaP (red) and PrEC (green) of three example oncogenes: KLK2; C15orf21; and ERBB3; and three example TSGs: CAV1, CAV2, and RND3 (top). (Bottom) UCSC Genome Browser tracks for DNA methylation (MBDCap.seq, red background), H3K27me3 (blue background), H2A.Z, acH2A.Z and acH2A.Z/H2A.Z ChIP-on-chip profiles. SssI (violet tracks): fully methylated positive control DNA. (B) Validation of tiling array, gene expression, and ChIP-on-chip data for H2A.Z, acH2A.Z, and acH2A.Z/H2A.Z using real-time qPCR. Relative mRNA levels normalized using GAPDH. For ChIP data, all samples were normalized with their corresponding Input chromatin and represented as 2-ΔCT (see Methods). H2A.Z and acHA.Z data are representative examples of three independent experiments; acH2A.Z/H2A.Z is represented as fold change of LNCaP relative to PrEC (mean of the fold change ±SEM). Note, for the ERBB3 gene, there is a gain of the relative acetylation of H2A.Z (acH2A.Z/H2A.Z fold enrichment) in LNCaP cells due to the relative depletion of total H2A.Z in this region (H2A.Z IP). Abbreviations, colors, and symbols are the same as in Figure 3.
Figure 5.
Figure 5.
Acetylation of H2A.Z correlates with gene activation in prostate cancer. (A) LNCaP cells were either untreated (−) or treated (+) with Trichostatin A (TSA) at 100 nM for 48 h. Gene expression levels of CAV1 and CAV2 (A) or LIMCH1, KLK2, and KLK3 (B) genes were measured by RT–qPCR, and acH2A.Z levels at TSSs were measured by ChIP qPCR. Relative mRNA levels were normalized using ALAS1. A concordant increase in acH2A.Z and gene activation, after TSA treatment was observed for all genes. (C) LNCaP cells were either untreated (−) or treated (+) with Anacardic Acid (AA) at 90 μM for 48 h. Gene expression levels of C15orf21, KLK2, and KLK3 genes were measured by RT–qPCR, and acH2A.Z levels at the TSS were measured by ChIP qPCR. Relative mRNA levels were normalized using ALAS1. A concordant decrease in acH2A.Z and gene repression, after AA treatment, was observed. (D) (Left) Microarray hybridization signals for mRNA expression levels in PrEC (green), LNCaP (red), DU-145 (orange), and PC-3 (yellow) of five gene examples KLK2, C15orf21, CAV2, CAV1, and RND3. (Right) acH2A.Z ChIP qPCR at the promoter region of KLK2, C15orf21, CAV2, CAV1, and RND3 as per Figure 4. Gray background in the bottom panel highlights an arbitrary threshold for the minimum acH2A.Z signal associated with gene activation. Acetylation of H2A.Z correlates with gene activation in all gene examples.
Figure 6.
Figure 6.
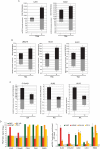
Anticorrelation between DNA methylation and H2A.Z or acH2A.Z in human prostate cancer. (A) Significance plots compared H2A.Z, acH2A.Z, and acH2A.Z/H2AZ with DNA methylation status in PrEC (top) and LNCaP cells (bottom). The average signal of corresponding ChIP-on-chip data (y-axis: signal intensity) of highly methylated genes (>80% relative to the SssI) is represented as a red line along the gene promoter (x-axis), whereas lowly methylated genes are represented as a black line (<20% relative to the SssI). Blue line represents randomly selected genes from the pool of neither high nor lowly methylated; light-blue background covers the 95% confidence interval of the data. (B) Significance plots for the average signal of H2A.Z, acH2A.Z, and acH2A.Z/H2A.Z along gene promoters that change in expression and DNA methylation in LNCaP compared with PrEC (LNCaP-PrEC). Red line corresponds to DNA hypermethylated (≥2-fold) and down-regulated (≥1.5 t-stats) genes; black line represents DNA hypomethylated (≤−2-fold) and down-regulated genes (≤−1.5 t-stats) in LNCaP-PrEC. (C) Three gene examples (RND3, MKRN3, and LIMCH1) that show change in acH2A.Z/H2A.Z promoter enrichment and DNA methylation in prostate cancer. ChIP qPCR of H2A.Z and acH2A.Z confirms a gain of acH2A.Z/H2A.Z. DNA methylation using Sequenom MALDI-TOF analysis of genomic DNA from the promoter region was calculated by averaging the ratios obtained from each CpG site from both LNCaP and PrEC. CpG sites correspond to the same regions analyzed for H2A.Z and acH2A.Z occupancy.
Figure 7.
Figure 7.
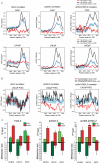
Anticorrelation between H3K27me3 and H2A.Z or acH2A.Z promoter presence in prostate cancer. (A) Significance plots of H3K27me3 signal comparing H2A.Z, acH2A.Z, and acH2A.Z/H2A.Z along gene promoters in genes sorted by high (red line) or low (black line) levels of H2A.Z, acH2A.Z, and acH2A.Z/H2A.Z in PrEC (top) and LNCaP (bottom). The selection criteria of H2A.Z, acH2A.Z, and acH2A.Z/H2A.Z for high levels were t-stats ≥ 1.5 (red line), and t-stats ≤ −1.5 for low levels (black line), as explained in the Supplemental Methods. (B) Significance plots of changes in the H3K27me3 signal (LNCaP-PrEC) along gene promoters in genes sorted by gain (t-stats ≥ 1.5, red line) or loss (t-stats ≤ −1.5, black line) of H2A.Z, acH2A.Z, and acH2A.Z/H2A.Z in LNCaP-PrEC. (C) ChIP qPCR using H3K27me3 antibody was performed to validate the anticorrelation in four different prostate cancer–related genes: CAV1 and RND3 (top) and KLK2 and LIMCH1 (bottom). See Figure 4 for validation of H2A.Z, acH2A.Z levels.
Figure 8.
Figure 8.
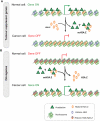
Model of gene transcriptional regulation dependent on H2A.Z occupancy and its acetylated state in prostate cancer. (A) In a normal cell, genes that are actively transcribed exhibit a bimodal distribution of at least three acetylated H2A.Z nucleosomes plus and minus the TSS. In cancer, some inactivated genes (including TSG), undergo epigenetic change across the promoter that includes deacetylation of H2A.Z nucleosomes, either through active deacetylation or exchange of a H2A.Z nucleosome (depicted as “?”). (B) In contrast, in a normal cell inactive genes contain a mix of H2A and H2A.Z nucleosomes across the entire promoter (H2A/H2A.Z nucleosomes). The apparent mix of H2A or H2A.Z–nucleosomes could be heterotypic nucleosomes containing one H2A dimer and one H2A.Z dimer, or H2A.Z and H2A homotypic nucleosomes deposited alternatively across the promoter. In a cancer cell there is a general loss of H2A.Z nucleosomes, together with a gain of acH2A.Z nucleosomes plus and minus three or more nucleosomes around the TSS, either through active acetylation or exchange of a H2A.Z nucleosome (depicted as “?”), resulting in an overexpression of these genes (e.g., oncogenes).

References

    1. Balasubramanyam K, Swaminathan V, Ranganathan A, Kundu TK 2003. Small molecule modulators of histone acetyltransferase p300. J Biol Chem 278: 19134–19140 - PubMed
    1. Barski A, Cuddapah S, Cui K, Roh TY, Schones DE, Wang Z, Wei G, Chepelev I, Zhao K 2007. High-resolution profiling of histone methylations in the human genome. Cell 129: 823–837 - PubMed
    1. Bernstein BE, Kamal M, Lindblad-Toh K, Bekiranov S, Bailey DK, Huebert DJ, McMahon S, Karlsson EK, Kulbokas EJ 3rd, Gingeras TR, et al. 2005. Genomic maps and comparative analysis of histone modifications in human and mouse. Cell 120: 169–181 - PubMed
    1. Bruce K, Myers FA, Mantouvalou E, Lefevre P, Greaves I, Bonifer C, Tremethick DJ, Thorne AW, Crane-Robinson C 2005. The replacement histone H2A.Z in a hyperacetylated form is a feature of active genes in the chicken. Nucleic Acids Res 33: 5633–5639 - PMC - PubMed
    1. Campos EI, Reinberg D 2009. Histones: annotating chromatin. Annu Rev Genet 43: 559–599 - PubMed

Publication types

MeSH terms