. 2011 Jul 25;194(2):187-97.
doi: 10.1083/jcb.201102076.

Septin GTPases spatially guide microtubule organization and plus end dynamics in polarizing epithelia

Affiliations

Septin GTPases spatially guide microtubule organization and plus end dynamics in polarizing epithelia

Jonathan R Bowen et al. J Cell Biol. .

Abstract

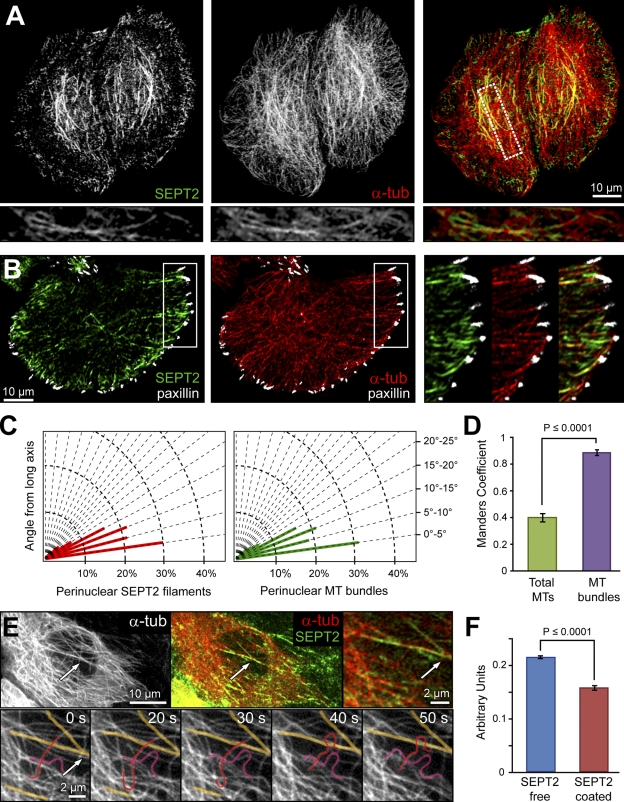
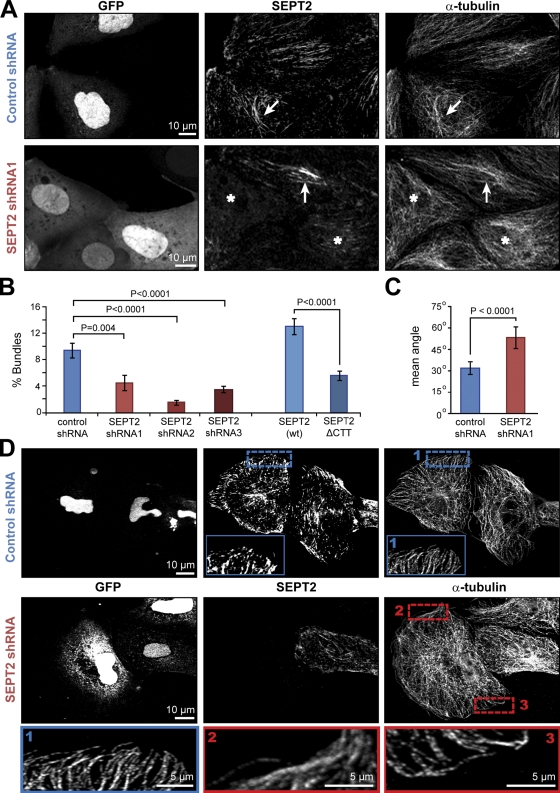
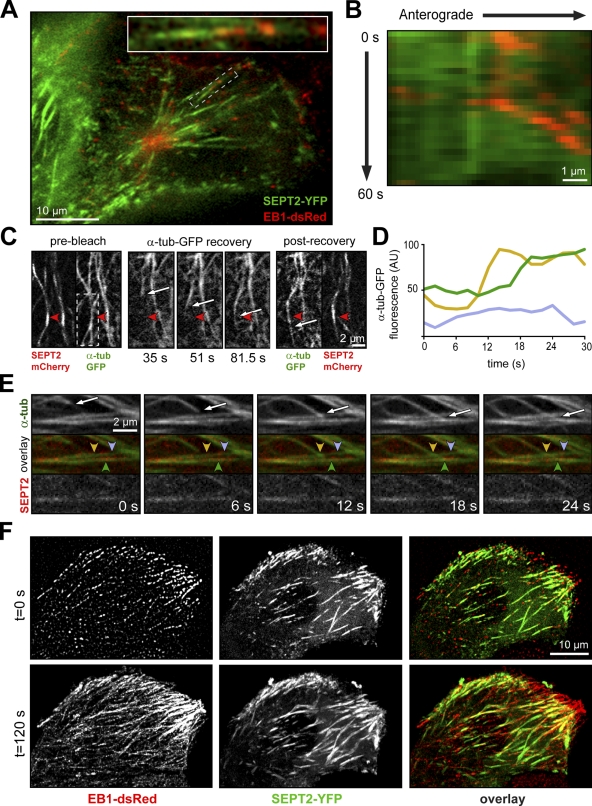
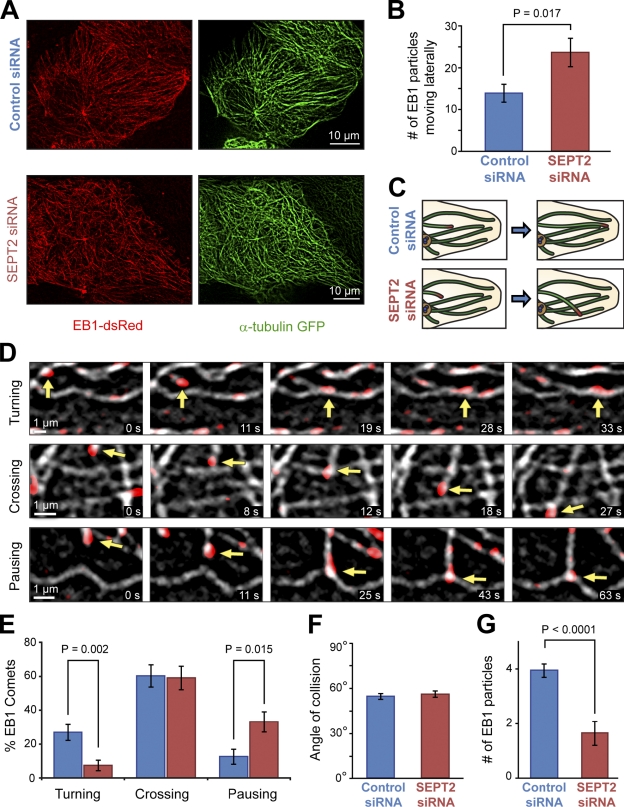
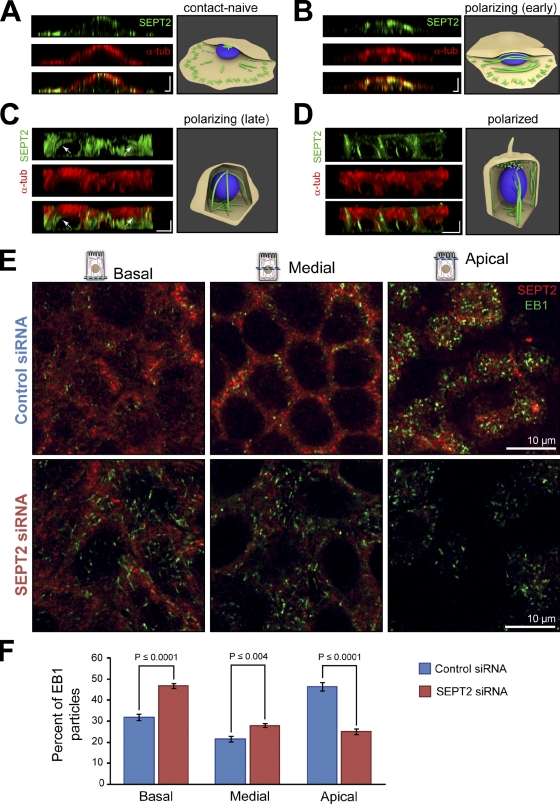
Establishment of epithelial polarity requires the reorganization of the microtubule (MT) cytoskeleton from a radial array into a network positioned along the apicobasal axis of the cell. Little is known about the mechanisms that spatially guide the remodeling of MTs during epithelial polarization. Septins are filamentous guanine triphosphatases (GTPases) that associate with MTs, but the function of septins in MT organization and dynamics is poorly understood. In this paper, we show that in polarizing epithelia, septins guide the directionality of MT plus end movement by suppressing MT catastrophe. By enabling persistent MT growth, two spatially distinct populations of septins, perinuclear and peripheral filaments, steer the growth and capture of MT plus ends. This navigation mechanism is essential for the maintenance of perinuclear MT bundles and for the orientation of peripheral MTs as well as for the apicobasal positioning of MTs. Our results suggest that septins provide the directional guidance cues necessary for polarizing the epithelial MT network.


Figures

Figure 1.
Figure 1.
Spatial segregation of septins within the MT network. (A) Maximum intensity projection of confocal microscopy z stacks of MDCKs stained for SEPT2 and α-tubulin. (bottom) A single confocal slice from the outlined area in high magnification. (B) Confocal microscopy image of MDCKs stained for SEPT2, α-tubulin, and paxillin. (right) High magnification images of the outlined region. (C) Distribution of the angles of perinuclear SEPT2 filaments (n = 177) and MT bundles (n = 155) from the long axis of the cells (n = 14). (D) Manders coefficients of SEPT2 colocalization with total MTs and MT bundles (n = 14 cells). (E) Spinning-disk confocal microscopy images of MDCK-SEPT2-mCherry cells transfected with α-tubulin (α-tub)–GFP. Arrows point to SEPT2-coated MTs (pseudocolored yellow in grayscale images). MTs free of SEPT2 were pseudocolored red. (F) Quantification of MT fluctuations using image subtraction analysis (Δt = 15 s). Graph shows changes in α-tubulin–GFP intensity values per micrometers squared for SEPT2-mCherry–coated and –free MTs relative to total MTs (8 cells; n = 50). Error bars represent SEM.
Figure 2.
Figure 2.
Septins are essential for the organization of perinuclear MT bundles and peripheral MTs. (A) Maximum intensity projections of confocal microscopy z stacks of MDCKs transfected with GFP-expressing control and SEPT2 shRNA 1 plasmids and stained for SEPT2 and α-tubulin. Arrows point to perinuclear longitudinal MT bundles. Asterisks mark SEPT2-depleted cells. (B) Quantification of MT bundles as the percentage of total MTs in cells transfected with control shRNA (n = 18), SEPT2 shRNA 1 (n = 15), shRNA 2 (n = 12), shRNA 3 (n = 13), GFP-tagged SEPT2 (n = 18), and SEPT2-ΔCTT (n = 21). (C) Graph shows the mean angle width between the distal ends of peripheral MTs and the effective cell radius (line between MT tips and the centroid of the cell) in MDCKs treated with control (10 cells; n = 50) and SEPT2 shRNAs (10 cells; n = 50). (D) Confocal microscopy images of MDCKs transfected with GFP-expressing control and SEPT2 shRNA and stained for α-tubulin. Insets show the distal ends of peripheral MTs in higher magnification. Error bars represent SEM. wt, wild type.
Figure 3.
Figure 3.
MT plus ends follow trajectories that coalign with septin filaments. (A) MDCK cells expressing EB1-dsRed and SEPT2-YFP. The inset shows EB1-dsRed comets that localize on a perinuclear SEPT2-YFP filament in high magnification. (B) Kymograph depicts the movement of EB1-dsRed along SEPT2-YFP. (C) FRAP of α-tubulin (α-tub)–GFP in MTs coated with SEPT2-mCherry. The dashed line demarcates the region of FRAP. Arrows point to MT tips. Arrowheads mark the position of SEPT2-mCherry. (D and E) Time-lapse images show docking and coalignment of an MT tip (arrows) with MTs coated with SEPT2-mCherry. Line graph shows the fluorescence intensity of α-tubulin–GFP at sites of MT–MT docking (yellow arrowheads) and alignment (green arrowheads) and at a point of no MT overlap (blue arrowheads). Note that α-tubulin–GFP intensity increases at points of MT overlap. (F) Spinning-disk confocal microscopy images of EB1-dsRed and SEPT2-YFP. Still frames and time-composite images are depicted in the top and bottom rows, respectively. AU, arbitrary unit.
Figure 4.
Figure 4.
Septins spatially guide MT growth and MT–MT interactions. (A) Time-composite images of EB1-dsRed and α-tubulin–GFP after the lapse of 60 s. MDCK-EB1-dsRed cells were transfected with α-tubulin–GFP and control/SEPT2 siRNAs. (B) Graph shows the mean number of intersecting EB1-dsRed trajectories after a lapse of 60 s per control (n = 18) and SEPT2-depleted (n = 20) cells. (C) Schematic depicts the lateral meandering of MT plus ends in the absence of SEPT2. (D) Dual-color time-lapse images of α-tubulin–GFP (grayscale) overlaid with EB1-dsRed (red). Panels depict three types of MT–MT interactions. Yellow arrows point to MT plus ends moving through the cytoplasm. (E and F) Quantification of EB1-dsRed head-on encounters with MTs in MDCKs transfected with α-tubulin–GFP and control (10 cells; n = 99) and SEPT2 siRNAs (12 cells; n = 98). Right histogram shows mean angle width of all EB1-MT encounters. Data were analyzed from 90-s-long videos. (G) MDCK-EB1-dsRed cells were transfected with paxillin-GFP and control and SEPT2 siRNAs. Graph shows mean number of EB1-dsRed particles that enter a focal adhesion per 60 s (five cells; n = 20–25). Error bars represent SEM.
Figure 5.
Figure 5.
Septins control the apicobasal distribution of epithelial MTs. (A and B) Confocal xz images of contact-naive and polarizing MDCK cells stained for SEPT2 and α-tubulin. Schematics show position of SEPT2 filaments with respect to the nucleus (blue). Bars, 2.5 µm. (C and D) Side views of 3D-rendered confocal images of MDCK cells plated on Transwell filters for 12 h (late stages of polarization) and 48 h (polarized). Arrows point to SEPT2 filaments that arch from the basolateral to the apical cytoplasm. Images were γ adjusted. Bars, 5 µm. (E) Confocal microscopy slices taken from the basal, medial, and apical sections of MDCK cells (24 h on Transwell) treated with control and SEPT2 siRNAs and stained for SEPT2 and EB1. (F) Graph shows the percentage of EB1 comets distributed in the apical, medial, and basal cytoplasm of control (n = 16) and SEPT2-depleted (n = 18) MDCK cells. α-tub, α-tubulin. Error bars represent SEM.

References

    1. Akhmanova A., Steinmetz M.O. 2008. Tracking the ends: a dynamic protein network controls the fate of microtubule tips. Nat. Rev. Mol. Cell Biol. 9:309–322 10.1038/nrm2369 - DOI - PubMed
    1. Amir S., Mabjeesh N.J. 2007. SEPT9_V1 protein expression is associated with human cancer cell resistance to microtubule-disrupting agents. Cancer Biol. Ther. 6:1926–1931 10.4161/cbt.6.12.4971 - DOI - PubMed
    1. Applewhite D.A., Grode K.D., Keller D., Zadeh A.D., Slep K.C., Rogers S.L. 2010. The spectraplakin Short stop is an actin-microtubule cross-linker that contributes to organization of the microtubule network. Mol. Biol. Cell. 21:1714–1724 (published erratum appears in Mol. Biol. Cell.2010. 21:2097) 10.1091/mbc.E10-01-0011 - DOI - PMC - PubMed
    1. Bacallao R., Antony C., Dotti C., Karsenti E., Stelzer E.H., Simons K. 1989. The subcellular organization of Madin-Darby canine kidney cells during the formation of a polarized epithelium. J. Cell Biol. 109:2817–2832 10.1083/jcb.109.6.2817 - DOI - PMC - PubMed
    1. Barth A.I., Siemers K.A., Nelson W.J. 2002. Dissecting interactions between EB1, microtubules and APC in cortical clusters at the plasma membrane. J. Cell Sci. 115:1583–1590 - PMC - PubMed

Publication types