. 2011 Aug;138(2):231-47.
doi: 10.1085/jgp.201010592.

Measurement of RyR permeability reveals a role of calsequestrin in termination of SR Ca(2+) release in skeletal muscle

Affiliations

Measurement of RyR permeability reveals a role of calsequestrin in termination of SR Ca(2+) release in skeletal muscle

Monika Sztretye et al. J Gen Physiol. 2011 Aug.

Abstract

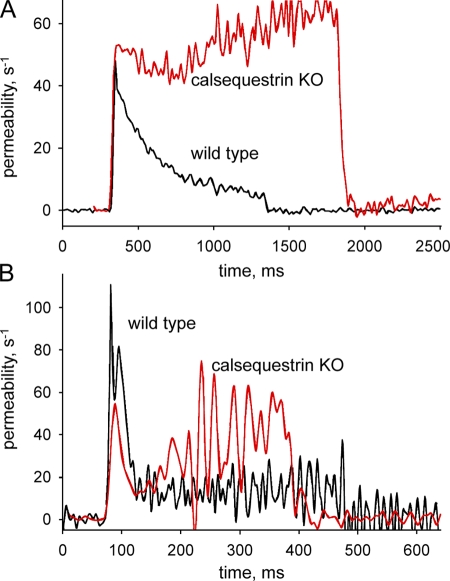
The mechanisms that terminate Ca(2+) release from the sarcoplasmic reticulum are not fully understood. D4cpv-Casq1 (Sztretye et al. 2011. J. Gen. Physiol. doi:10.1085/jgp.201010591) was used in mouse skeletal muscle cells under voltage clamp to measure free Ca(2+) concentration inside the sarcoplasmic reticulum (SR), [Ca(2+)](SR), simultaneously with that in the cytosol, [Ca(2+)](c), during the response to long-lasting depolarization of the plasma membrane. The ratio of Ca(2+) release flux (derived from [Ca(2+)](c)(t)) over the gradient that drives it (essentially equal to [Ca(2+)](SR)) provided directly, for the first time, a dynamic measure of the permeability to Ca(2+) of the releasing SR membrane. During maximal depolarization, flux rapidly rises to a peak and then decays. Before 0.5 s, [Ca(2+)](SR) stabilized at ∼35% of its resting level; depletion was therefore incomplete. By 0.4 s of depolarization, the measured permeability decayed to ∼10% of maximum, indicating ryanodine receptor channel closure. Inactivation of the t tubule voltage sensor was immeasurably small by this time and thus not a significant factor in channel closure. In cells of mice null for Casq1, permeability did not decrease in the same way, indicating that calsequestrin (Casq) is essential in the mechanism of channel closure and termination of Ca(2+) release. The absence of this mechanism explains why the total amount of calcium releasable by depolarization is not greatly reduced in Casq-null muscle (Royer et al. 2010. J. Gen. Physiol. doi:10.1085/jgp.201010454). When the fast buffer BAPTA was introduced in the cytosol, release flux became more intense, and the SR emptied earlier. The consequent reduction in permeability accelerated as well, reaching comparable decay at earlier times but comparable levels of depletion. This observation indicates that [Ca(2+)](SR), sensed by Casq and transmitted to the channels presumably via connecting proteins, is determinant to cause the closure that terminates Ca(2+) release.


Figures

Figure 1.
Figure 1.
Kinetic parameters of X-rhod-1. (A) Baseline-normalized and line-averaged fluorescence F/F0 of Rhod-2 and X-rhod-1 in a WT muscle cell subjected to a voltage clamp pulse of 50 ms to 30 mV. Fluorescence of Rhod-2 was excited at 514 nm and collected between 540 and 570 nm. The corresponding wavelengths for X-rhod-1 were 594, 610, and 700 nm. The excitation lights were interspersed line by line. (B, solid trace) [Ca2+]c calculated from the fluorescence trace of Rhod-2 in A using Eq. 2, with Fmax/Fmin determined in our laboratory and kinetic parameters provided by Escobar et al. (1997), including Kd = 1.58 µM and kOFF = 130 s−1. (dashed trace) [Ca2+]c calculated from the fluorescence trace of X-rhod-1 using Eqs. 2 and 3, with Fmax/Fmin determined in our laboratory and kinetic parameters adjusted for best fit to the function derived from Rhod-2. Best fit values were kON = 2.6 107 M−1s−1 and kOFF = 100 s−1. ID: 031611b series 35.
Figure 2.
Figure 2.
Simultaneous determination of [Ca2+]c(t) and [Ca2+]SR(t) in a muscle cell. (A) Fluorescence of X-rhod-1 in cytosol. Cell perfused with EGTA solution subjected to the voltage clamp pulse drawn at top. Fluorescence was normalized to resting time average F0(x). The plot is of spatially averaged F(t)/F0. (B) R = F2(x,t)/F1(x,t) of simultaneously recorded line scans of fluorescence of the biosensor, D4cpv-Casq1 in this case, with specific wavelengths of excitation and emission given in Materials and methods. The plot is of spatially averaged R. The dashed line marks Rmin. (C) Plots of release flux (black) calculated from F(t)/F0 and [Ca2+]SR (red) calculated from R(t) by Eq. 1. The final [Ca2+]SR level reached during this depolarization is close to the average (namely 179 µM; listed in Table I). ID: 072309a_series106. Average of six line scans obtained with 3-min intervals at between 130 and 145 min after establishing whole-cell patch is shown.
Figure 3.
Figure 3.
Simultaneous determination of [Ca2+]c(t) and [Ca2+]SR(t) in a Casq1-null cell. (A) Fluorescence of cytosolic monitor in cell perfused with EGTA. (B) R(x,t) and (in white trace) its line average R(t). The dashed line marks Rmin. (C) Release flux (black) and [Ca2+]SR(t) (red). Details of description were given in legend of Fig. 2. Note the greatly increased degree of depletion by the end of the pulse. Also note the continued decrease of R(t) during the pulse, contrasting with stabilization in the WT (Fig. 2). ID: 062410a _s34. Average of eight line scans obtained 31–51 min after establishing whole-cell patch is shown.
Figure 4.
Figure 4.
[Ca2+]c(t) and [Ca2+]SR(t) in a WT cell with BAPTA. (A) Fluorescence of X-rhod-1. (B) R(x,t) and (in white trace) its line average R(t). (C) Plots of release flux and [Ca2+]SR(t) as in Figs. 2 and 3. Internal solution was BAPTA. Note the radical changes in amplitude and kinetics of flux compared with Fig. 2, most notably an increase in peak and intermediate level, with a reduction in duration of the intermediate stage and the appearance of a hump (arrow). Also note a greatly expanded temporal scale, to better display the hastened kinetics. ID: 051209b _s43. Average of 13 line scan images taken 47–72 min after patching is shown.
Figure 5.
Figure 5.
[Ca2+] in cytosol and SR in a Casq-null cell with BAPTA. (A) Fluorescence of X-rhod. (B) R(x,t) and (in white trace) its line average R(t). (C) Release flux (black) and [Ca2+]SR(t) (red). Details of description were given in legend of Fig. 2. Note the rapid stabilization of fluorescence in the cytosol and rapid decay of release flux to very low levels, which is a consequence of the presence of BAPTA. Also note the lack of any shoulder or hump in the evolution of release flux and the drastic decay of [Ca2+]SR to nearly 0, which is a consequence of the absence of Casq. ID: 082009b_s34. Average of 10 line scan images taken 48–68 min after patching is shown.
Figure 6.
Figure 6.
Effects of a conditioning depolarization on the t tubule voltage sensor. (A) Intramembranous charge movement currents IQ in test depolarizations to a variable level Vm applied from rest or after a conditioning depolarization (diagram at top). (B) Charge displacement Qm versus Vm in the range 0–40 mV for the same cell, with displacement during the ON (QON) represented by closed symbols, QOFF values by open symbols, and the conditioned values in red. QOFF values become progressively greater than QON at Vm > 0 mV, which is an indication that large test voltages activate ionic currents that interfere with the measurement of Qm. The continuous curves plot Boltzmann fits QON = Qmax/(1 + exp(−(VmVT)/K)). In reference (black), the parameter values were Qmax = 24.0 nC/μF, VT = −16.4 mV, and K = 16.5 mV. After conditioning (red) Qmax = 19.0 nC/μF, VT = −20.3 mV, and K = 16.3 mV. ID: 1066E. (C) Qm averaged over 10 experiments at test voltages up to 0 mV. Symbols and colors are as described for B. Error bars represent SEM. In this range, the averages of QON and QOFF were not significantly different, and the changes induced by the conditioning depolarization were not significantly different from zero. ID: 1059E through 1069E (excludes 1062E).
Figure 7.
Figure 7.
Release flux and FRET ratio in a cell with spatially heterogeneous biosensor expression. (A) Biosensor concentration (invariant image) calculated as described in Eq. A6 of Sztretye et al. (2011). (B) FRET ratio R. (C) Histogram of pixel values of R. The distribution is narrow, which is consistent with a lack of effect on R of the variation in [biosensor]. (D) R(t) in line scans along dashed line in A, averaged over regions a (high [biosensor]) and b (low) indicated by line segments at the bottom of A. The average concentration of biosensor was 7.54 µM and 1.54 µM, respectively, in a and b. Note slightly greater R in region b. (E and F) Rnet(t) and its integral Rel(t) (Eq. 4) in regions a and b. No difference is visible in spite of the large change in biosensor concentration. ID: 072309a image 29.
Figure 8.
Figure 8.
Ca2+ release permeability. Permeability, calculated as defined in Eq. 5, during a long-lasting, supramaximal pulse is shown. (A) For cells shown in Figs. 2 and 3, in which the solution in the pipette was EGTA. (B) For cells in Figs. 4 and 5, in which the solution in the pipette was BAPTA. Note how the permeability decays sharply during a pulse in the WT; it either remains elevated or recovers after initially decaying in the Casq KO.
Figure 9.
Figure 9.
The time course of flux is different in frogs and mice. The black trace shows release flux in a WT mouse FDB cell, activated by the voltage clamp pulse represented at the top. The green trace shows a comparable record for a cell from frog semitendinosus muscle voltage clamped in a Vaseline gap. Records are scaled to match the levels reached after the early peak. Note in the mouse the more complex decay, described as a shoulder. Cells are in similar but not identical solutions designed to block ionic currents. Both internal solutions had 10 mM EGTA. The mouse cell was studied by Royer et al. (2008). The frog cell was studied by Rengifo et al. (2002).

Similar articles

Cited by

References

    1. Baylor S.M., Chandler W.K., Marshall M.W. 1982. Use of metallochromic dyes to measure changes in myoplasmic calcium during activity in frog skeletal muscle fibres. J. Physiol. 331:139–177 - PMC - PubMed
    1. Baylor S.M., Chandler W.K., Marshall M.W. 1983. Sarcoplasmic reticulum calcium release in frog skeletal muscle fibres estimated from Arsenazo III calcium transients. J. Physiol. 344:625–666 - PMC - PubMed
    1. Canato M., Scorzeto M., Giacomello M., Protasi F., Reggiani C., Stienen G.J. 2010. Massive alterations of sarcoplasmic reticulum free calcium in skeletal muscle fibers lacking calsequestrin revealed by a genetically encoded probe. Proc. Natl. Acad. Sci. USA. 107:22326–22331 10.1073/pnas.1009168108 - DOI - PMC - PubMed
    1. Dainese M., Quarta M., Lyfenko A.D., Paolini C., Canato M., Reggiani C., Dirksen R.T., Protasi F. 2009. Anesthetic- and heat-induced sudden death in calsequestrin-1-knockout mice. FASEB J. 23:1710–1720 10.1096/fj.08-121335 - DOI - PMC - PubMed
    1. Donoso P., Prieto H., Hidalgo C. 1995. Luminal calcium regulates calcium release in triads isolated from frog and rabbit skeletal muscle. Biophys. J. 68:507–515 10.1016/S0006-3495(95)80212-2 - DOI - PMC - PubMed

Publication types

MeSH terms