

Demographic processes underlying subtle patterns of population structure in the scalloped hammerhead shark, Sphyrna lewini
- PMID: 21789171
- PMCID: PMC3137562
- DOI: 10.1371/journal.pone.0021459
Demographic processes underlying subtle patterns of population structure in the scalloped hammerhead shark, Sphyrna lewini
Abstract
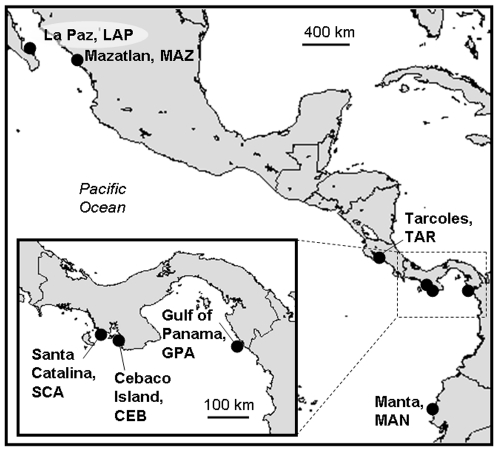
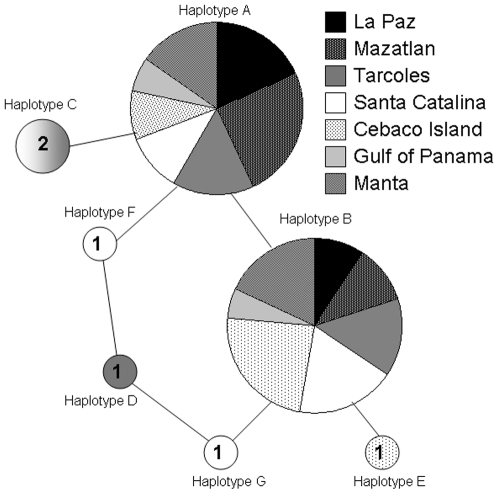
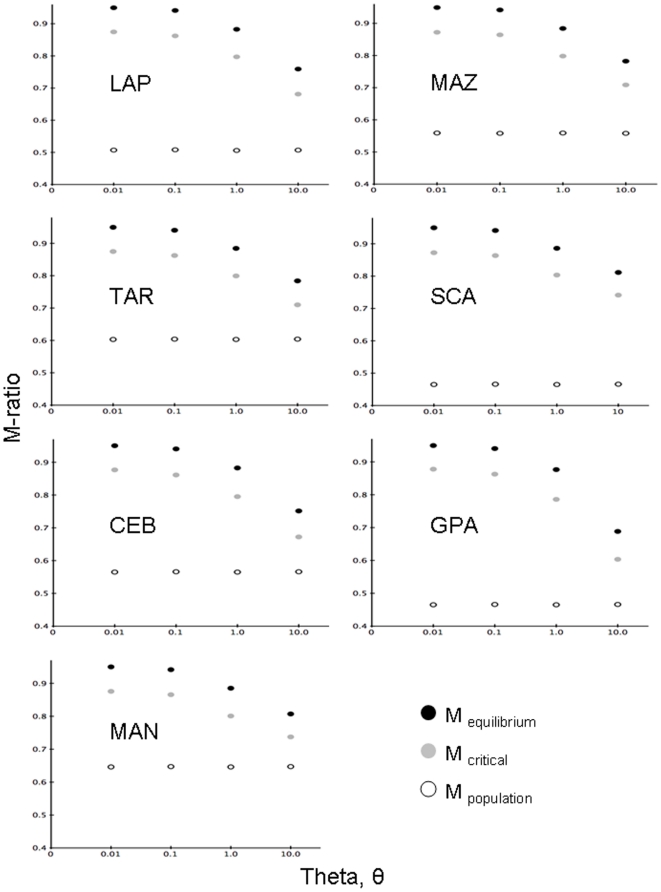
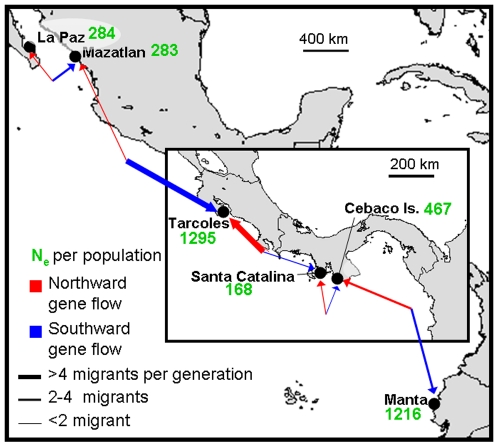
Genetic diversity (θ), effective population size (N(e)), and contemporary levels of gene flow are important parameters to estimate for species of conservation concern, such as the globally endangered scalloped hammerhead shark, Sphyrna lewini. Therefore, we have reconstructed the demographic history of S. lewini across its Eastern Pacific (EP) range by applying classical and coalescent population genetic methods to a combination of 15 microsatellite loci and mtDNA control region sequences. In addition to significant population genetic structure and isolation-by-distance among seven coastal sites between central Mexico and Ecuador, the analyses revealed that all populations have experienced a bottleneck and that all current values of θ are at least an order of magnitude smaller than ancestral θ, indicating large decreases in N(e) (θ = 4N(e)μ), where μ is the mutation rate. Application of the isolation-with-migration (IM) model showed modest but significant genetic connectivity between most sampled sites (point estimates of Nm = 0.1-16.7), with divergence times (t) among all populations significantly greater than zero. Using a conservative (i.e., slow) fossil-based taxon-specific phylogenetic calibration for mtDNA mutation rates, posterior probability distributions (PPDs) for the onset of the decline in N(e) predate modern fishing in this region. The cause of decline over the last several thousand years is unknown but is highly atypical as a post-glacial demographic history. Regardless of the cause, our data and analyses suggest that S. lewini was far more abundant throughout the EP in the past than at present.
Conflict of interest statement
Figures

Similar articles
-
Conservation Genetics of the Scalloped Hammerhead Shark in the Pacific Coast of Colombia.J Hered. 2015;106 Suppl 1:448-58. doi: 10.1093/jhered/esv050. J Hered. 2015. PMID: 26245780
-
Global phylogeography with mixed-marker analysis reveals male-mediated dispersal in the endangered scalloped hammerhead shark (Sphyrna lewini).PLoS One. 2012;7(1):e29986. doi: 10.1371/journal.pone.0029986. Epub 2012 Jan 10. PLoS One. 2012. PMID: 22253848 Free PMC article.
-
Genetic connectivity of the scalloped hammerhead shark Sphyrna lewini across Indonesia and the Western Indian Ocean.PLoS One. 2020 Oct 1;15(10):e0230763. doi: 10.1371/journal.pone.0230763. eCollection 2020. PLoS One. 2020. PMID: 33002022 Free PMC article.
-
Population structure and genetic connectivity of the scalloped hammerhead shark (Sphyrna lewini) across nursery grounds from the Eastern Tropical Pacific: Implications for management and conservation.PLoS One. 2022 Dec 16;17(12):e0264879. doi: 10.1371/journal.pone.0264879. eCollection 2022. PLoS One. 2022. PMID: 36525407 Free PMC article.
-
A priority nursery area for the conservation of the scalloped hammerhead shark Sphyrna lewini in Mexico.J Fish Biol. 2022 Dec;101(6):1623-1627. doi: 10.1111/jfb.15227. Epub 2022 Nov 1. J Fish Biol. 2022. PMID: 36208114
Cited by
-
Can novel genetic analyses help to identify low-dispersal marine invasive species?Ecol Evol. 2014 Jul;4(14):2848-66. doi: 10.1002/ece3.1129. Epub 2014 Jun 24. Ecol Evol. 2014. PMID: 25165524 Free PMC article.
-
Genetic population dynamics of the critically endangered scalloped hammerhead shark (Sphyrna lewini) in the Eastern Tropical Pacific.Ecol Evol. 2022 Dec 28;12(12):e9642. doi: 10.1002/ece3.9642. eCollection 2022 Dec. Ecol Evol. 2022. PMID: 36619714 Free PMC article.
-
Crossing lines: a multidisciplinary framework for assessing connectivity of hammerhead sharks across jurisdictional boundaries.Sci Rep. 2017 Apr 21;7:46061. doi: 10.1038/srep46061. Sci Rep. 2017. PMID: 28429742 Free PMC article.
-
Genetic structure and signatures of selection in grey reef sharks (Carcharhinus amblyrhynchos).Heredity (Edinb). 2017 Sep;119(3):142-153. doi: 10.1038/hdy.2017.21. Epub 2017 Apr 19. Heredity (Edinb). 2017. PMID: 28422134 Free PMC article.
-
Reconstructing the demographic history of divergence between European river and brook lampreys using approximate Bayesian computations.PeerJ. 2016 Apr 7;4:e1910. doi: 10.7717/peerj.1910. eCollection 2016. PeerJ. 2016. PMID: 27077007 Free PMC article.
References
-
- Rose GA, deYoung B, Kulka DW, Goddard SV, Fletcher GL. Distribution shifts and overfishing the northern cod (Gadus morhua): a view from the ocean. Can J Fish Aquat Sci. 2000;57:644–663.
-
- Porch CE, Eklund AM, Scott GP. A catch-free stock assessment model with application to goliath grouper (Epinephelus itajara) off southern Florida. Fish Bull. 2006;104:89–101.
-
- MacKenzie BR, Myers RA. The development of the northern European fishery for north Atlantic bluefin tuna Thunnus thynnus during 1900–1950. Fish Res. 2007;87:229–239.
-
- Holt T, Medley P, Rice J, Cooper J, Hough A. Certification report for South Georgia Patagonian Toothfish longline fishery. 2001. Moody Marine, Ltd., Birkenhead.
-
- Kraus SD, Brown MW, Caswell H, Clark CW, Fujiwara M, et al. North Atlantic right whales in crisis. Science. 2005;309:561–562. - PubMed
Publication types
MeSH terms
Substances
LinkOut - more resources
Full Text Sources
Research Materials
Miscellaneous
