

Spatio-temporal dependence of the signaling response in immune-receptor trafficking networks regulated by cell density: a theoretical model
- PMID: 21789180
- PMCID: PMC3136476
- DOI: 10.1371/journal.pone.0021786
Spatio-temporal dependence of the signaling response in immune-receptor trafficking networks regulated by cell density: a theoretical model
Abstract
Cell signaling processes involve receptor trafficking through highly connected networks of interacting components. The binding of surface receptors to their specific ligands is a key factor for the control and triggering of signaling pathways. In most experimental systems, ligand concentration and cell density vary within a wide range of values. Dependence of the signal response on cell density is related with the extracellular volume available per cell. This dependence has previously been studied using non-spatial models which assume that signaling components are well mixed and uniformly distributed in a single compartment. In this paper, a mathematical model that shows the influence exerted by cell density on the spatio-temporal evolution of ligands, cell surface receptors, and intracellular signaling molecules is developed. To this end, partial differential equations were used to model ligand and receptor trafficking dynamics through the different domains of the whole system. This enabled us to analyze several interesting features involved with these systems, namely: a) how the perturbation caused by the signaling response propagates through the system; b) receptor internalization dynamics and how cell density affects the robustness of dose-response curves upon variation of the binding affinity; and c) that enhanced correlations between ligand input and system response are obtained under conditions that result in larger perturbations of the equilibrium ligand + surface receptor [Please see text] ligand - receptor complex. Finally, the results are compared with those obtained by considering that the above components are well mixed in a single compartment.
Conflict of interest statement
Figures
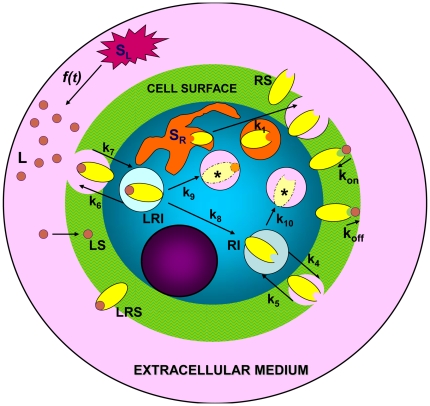
 by a source
  , and free receptors are synthesized by the cell at rate
  . The domains are not drawn to scale especially the cell surface.
 ,
,  ,
,  . The spherical surfaces
  and
and  are so close that they appear overlapped; B)
  , other conditions as in A. Note the different scales in A) and B) although the volume of the cell is the same in both cases. Bottom: A) cross section representation of top domain A. The two circles
  (blue) and
  (red) can be now distinguished; B) cross section representation of top domain B.
 ,
,  nM,
nM,  ,
,  , for four cell densities: A) high cell density,
  ; B) medium-high cell density,
  ; C) medium-low cell density,
  ; D) low cell density,
  . The rate constants used are given in Table 2.
 ) and low (B,
  ) cell densities. Note the difference of scale in both figures although the cell volume does not change. Other conditions as in Fig.3.
 ) and
) and  nM for
  s (A) and
  s (B). These profiles are defined in the extracellular medium (
 ) and distance is measured in the radial direction from the cell surface, i.e.
  . The 2D plots (not shown) viewed from the cell surface appear blue-red in (A) and red-blue in (B).
 ) for
) for  nM. The
  -values (s) are: a) 10; b)
  ; c)
; c)  ; d)
; d)  ; e)
; e)  ; f)
; f)  ; g)
; g)  ; h)
; h)  . These profiles are defined in the extracellular medium (
 ) and distance is defined as in Fig.5. The corresponding 2D plots (not shown) viewed from the cell surface appear blue-red.
 ) for
) for  nM. These profiles are defined in the extracellular medium (
 ) and distance (
 ) measured from the cell surface in a radial direction is: a) 0; b) 2.4; c) 7.4; d) 17.4; e) 42.4. The dashed line f) is the profile computed with the non-spatial model of ref. using the kinetic parameters given in this reference and in Table 2.
 ) and
) and  . The white space inside the larger circle is the extracellular medium. The concentration gradients of LRI and RI are established in opposite directions. Bottom: concentration-time profiles of LRI and RI at close proximity to the cell surface (
 , curves a) and at the center of the cell (
 , curves b). Other conditions as in Fig.3.
 . When
  is expressed in
  the cell density-values are given by
  cells/ml. Internalized species (receptors and ligand-receptor complexes) values were computed at the center of the cell (
 ), while surface species were determined at
  .
.  nM,
nM,  min. Other conditions as in Fig.3.
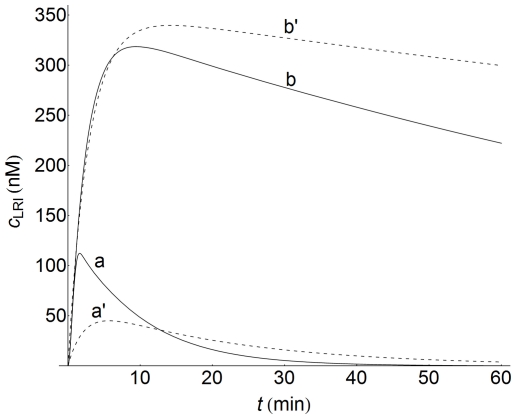
 , curves a) and low (
 , curves b) cell densities. LRI-values were obtained at the center of the cell (
 ). The dashed lines (curves a' and b') are the profiles computed with the non-spatial model of ref. using the kinetic parameters given in this reference and in Table 2. Other conditions as in Fig.3.
 ) and expressed as the area under the concentration-time profiles for 10 hours. Integration was performed expressing the concentrations of
  in nM and times in min. The ligand concentration
  is given in nM. The values of
  (
( ) are: a) 100; b) 50; c) 30; d) 15.
 : curves (a,a')
  , curves (b,b')
  . X = LRS (solid lines), X = LRI (dashed lines). Panel A: curves obtained using the spatial model with
  . The spatial domain for LRS is
  and for LRI
  . The time profiles were computed at
  for LRS and at the center of the cell (
 ) for LRI. The parameters used for computation are those given in Table 2, except curves b and b' which were obtained with a 10-fold increase in the
  -value. Panel B: curves computed using the non-spatial model of ref. and the kinetic parameters given in this reference and in Table 2. Curves (a,a')
  , curves (b,b')
  .
.
 : curves (a,a')
  , curves (b,b')
  . X = LRS (solid lines), X = LRI (dashed lines). There is no recycling of empty receptors to cell surface (
 ). Panel A: curves obtained using the spatial model. Panel B: curves obtained with the non-spatial model of ref.. Other conditions for panels A and B as in Fig.12.
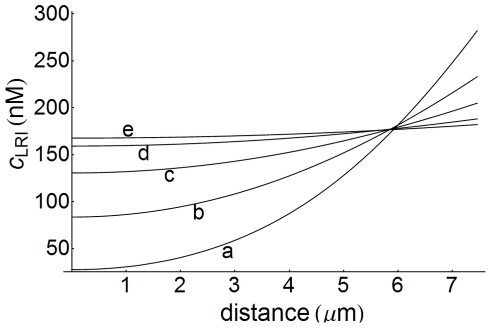
 (medium cell density) and
  s as a function of diffusion coefficient. These profiles are defined inside the cell (
 ) and distance is measured in the radial direction from the center of the cell. The values of the diffusion coefficient
  ) are: a) 0.05; b) 0.1; c) 0.2; d) 0.5; e) 1. Other conditions as in Fig.3.
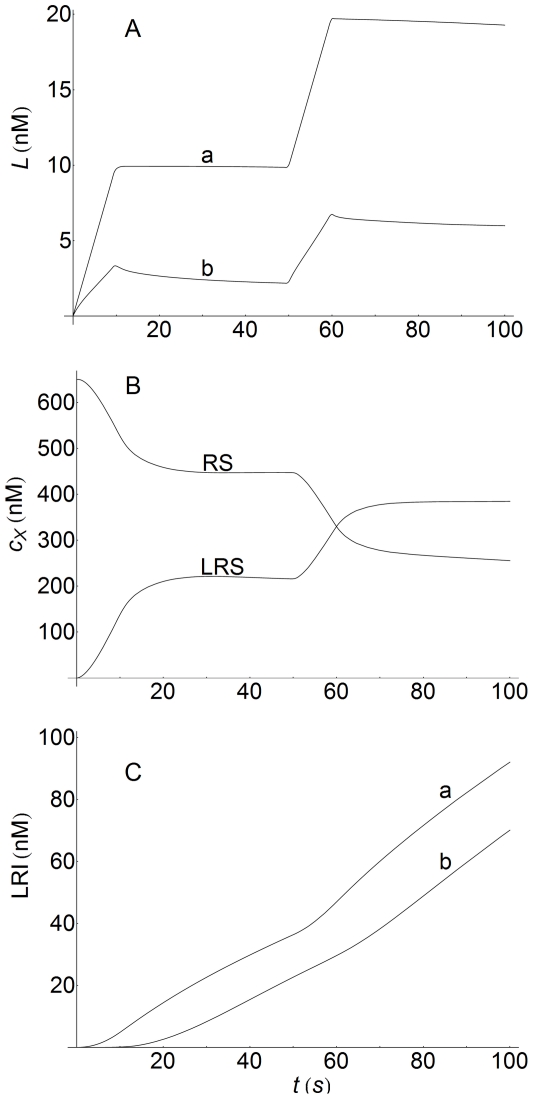
 ,
,  ,
,  . Panel A: ligand response computed at the outer region of the extracellular medium (
 , curve a) and at the interface with the cell surface (
 , curve b). Panel B: concentration-time profiles of empty (X = RS) and occupied (X = LRS) cell surface receptors obtained at
  . Panel C: concentration-time profiles of internalized ligand-receptor complexes computed at the surface of the cell (
 , curve a) and in the center of the cell (
 , curve b). Other conditions as in Fig.3.
 ,
,  . The ligand response was computed at the interface between cell surface and extracellular medium (
 ). The surface ligand-receptor complex response was determined at
  . Panels A:
  . Panels B:
  . Other conditions as in Fig.3.
Similar articles
-
Mathematical modelling and computational study of two-dimensional and three-dimensional dynamics of receptor-ligand interactions in signalling response mechanisms.J Math Biol. 2014 Sep;69(3):553-82. doi: 10.1007/s00285-013-0712-4. Epub 2013 Jul 28. J Math Biol. 2014. PMID: 23893005
-
Cellular signaling is potentially regulated by cell density in receptor trafficking networks.FEBS Lett. 2007 Oct 2;581(24):4589-95. doi: 10.1016/j.febslet.2007.08.047. Epub 2007 Aug 31. FEBS Lett. 2007. PMID: 17825822
-
Cell surface receptors for signal transduction and ligand transport: a design principles study.PLoS Comput Biol. 2007 Jun;3(6):e101. doi: 10.1371/journal.pcbi.0030101. Epub 2007 Apr 20. PLoS Comput Biol. 2007. PMID: 17542642 Free PMC article. Review.
-
Calcium-Sensing Receptor: Trafficking, Endocytosis, Recycling, and Importance of Interacting Proteins.Prog Mol Biol Transl Sci. 2015;132:127-50. doi: 10.1016/bs.pmbts.2015.02.006. Epub 2015 Apr 25. Prog Mol Biol Transl Sci. 2015. PMID: 26055057 Review.
-
Utilization of extracellular information before ligand-receptor binding reaches equilibrium expands and shifts the input dynamic range.Proc Natl Acad Sci U S A. 2014 Sep 16;111(37):E3860-9. doi: 10.1073/pnas.1322761111. Epub 2014 Aug 29. Proc Natl Acad Sci U S A. 2014. PMID: 25172920 Free PMC article.
Cited by
-
Essential requirement of complex number for oscillatory phenomenon in intracellular trafficking process.Comput Struct Biotechnol J. 2021 Apr 25;19:2990-3005. doi: 10.1016/j.csbj.2021.04.053. eCollection 2021. Comput Struct Biotechnol J. 2021. PMID: 34136098 Free PMC article.
-
Mathematical modelling and computational study of two-dimensional and three-dimensional dynamics of receptor-ligand interactions in signalling response mechanisms.J Math Biol. 2014 Sep;69(3):553-82. doi: 10.1007/s00285-013-0712-4. Epub 2013 Jul 28. J Math Biol. 2014. PMID: 23893005
References
-
- Ravasz E, Somera AL, Mongru DA, Oltvai ZN, Barabási A. Hierarchical organization of modularity in metabolic networks. Science. 2002;297:1551–1555. - PubMed
-
- Hartwell LH, Hopfield JJ, Leibler S, Murray AW. From molecular to modular cell biology. Nature. 1999;402:C47–52. - PubMed
-
- Hoffmann A, Levchenko A, Scott ML, Baltimore D. The IkB-NF-kB Signaling Module: Temporal control and selective gene activation. Science. 2002;298:1241–1245. - PubMed
Publication types
MeSH terms
Substances
LinkOut - more resources
Full Text Sources
