. 2011;6(7):e21800.
doi: 10.1371/journal.pone.0021800. Epub 2011 Jul 18.

REVIGO summarizes and visualizes long lists of gene ontology terms

Affiliations

REVIGO summarizes and visualizes long lists of gene ontology terms

Fran Supek et al. PLoS One. 2011.

Abstract

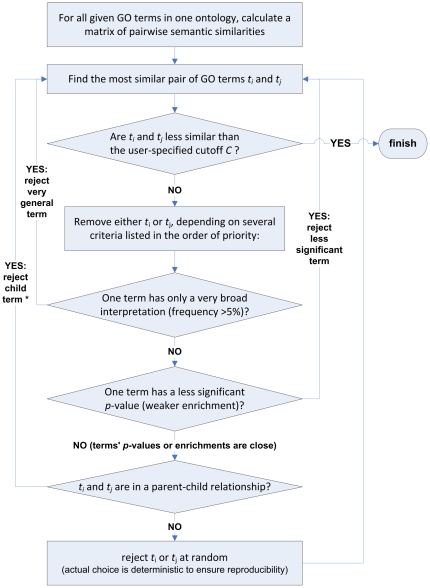
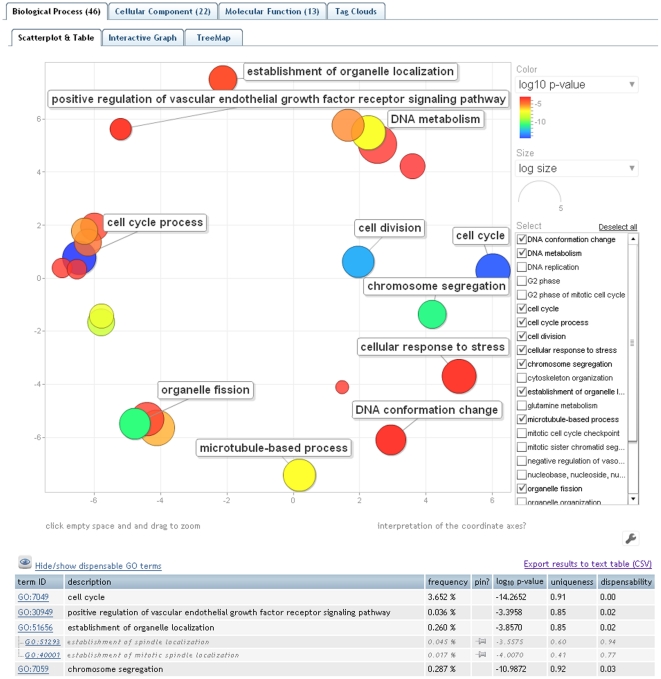
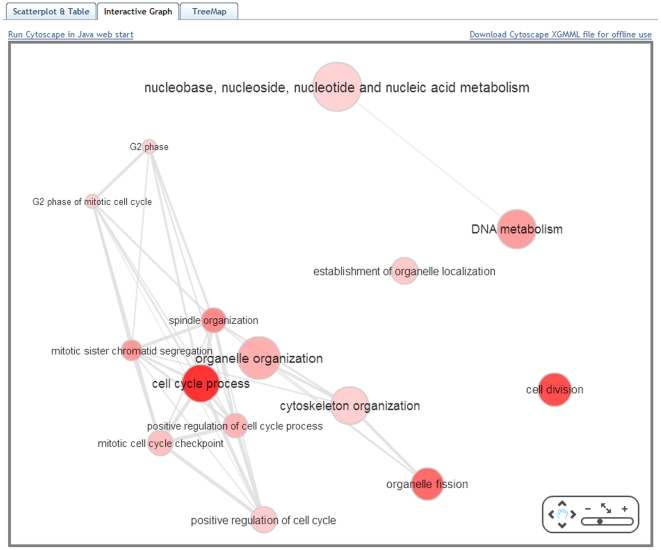
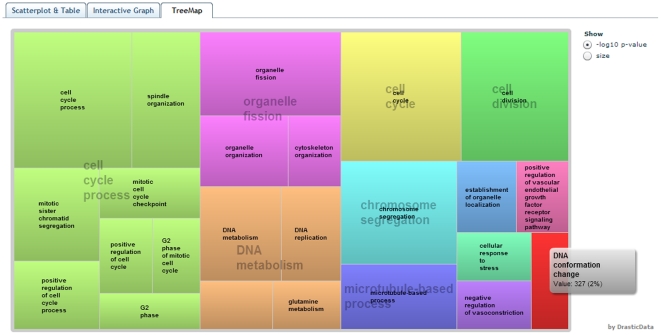
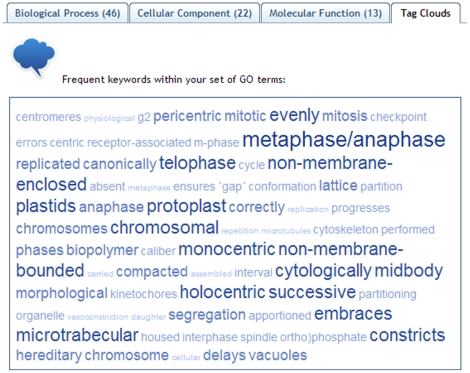
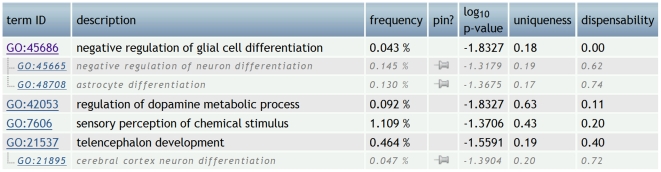
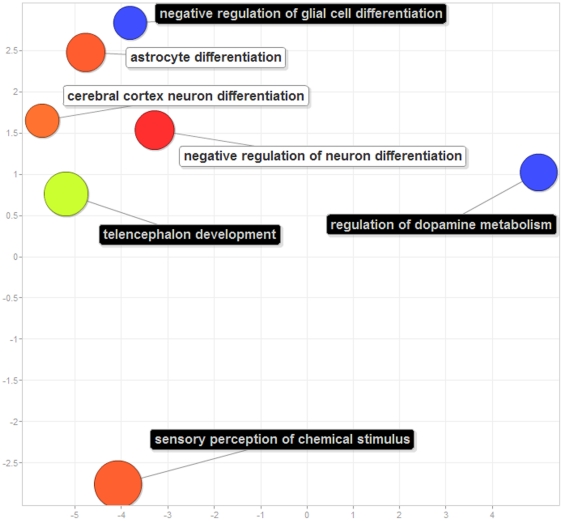
Outcomes of high-throughput biological experiments are typically interpreted by statistical testing for enriched gene functional categories defined by the Gene Ontology (GO). The resulting lists of GO terms may be large and highly redundant, and thus difficult to interpret.REVIGO is a Web server that summarizes long, unintelligible lists of GO terms by finding a representative subset of the terms using a simple clustering algorithm that relies on semantic similarity measures. Furthermore, REVIGO visualizes this non-redundant GO term set in multiple ways to assist in interpretation: multidimensional scaling and graph-based visualizations accurately render the subdivisions and the semantic relationships in the data, while treemaps and tag clouds are also offered as alternative views. REVIGO is freely available at http://revigo.irb.hr/.


Conflict of interest statement

Competing Interests: The authors have declared that no competing interests exist.

Figures

Figure 1
Figure 1. A flowchart describing the REVIGO algorithm to remove redundant GO terms from the provided GO term list.
* In a special case when the parent term in question is composed almost exclusively of the child term (>75%), the parent term is rejected instead.
Figure 2
Figure 2. The “Scatterplot & Table” view of REVIGO.
The scatterplot shows the cluster representatives (i.e. terms remaining after the redundancy reduction) in a two dimensional space derived by applying multidimensional scaling to a matrix of the GO terms' semantic similarities. The table view in the lower part of the figure is truncated; cluster representatives are given in black and other cluster members in gray letters. Bubble color indicates the user-provided p-value (legend in upper right-hand corner); size indicates the frequency of the GO term in the underlying GOA database (bubbles of more general terms are larger).
Figure 3
Figure 3. The “Interactive graph” view of REVIGO.
Bubble color indicates the user-provided p-value; bubble size indicates the frequency of the GO term in the underlying GOA database. Highly similar GO terms are linked by edges in the graph, where the line width indicates the degree of similarity. The initial placement of the nodes is determined by a ‘force-directed’ layout algorithm that aims to keep the more similar nodes closer together, but the placement may later be adjusted by the user.
Figure 4
Figure 4. The “TreeMap” view of REVIGO.
Each rectangle is a single cluster representative. The representatives are joined into ‘superclusters’ of loosely related terms, visualized with different colors. Size of the rectangles may be adjusted to reflect either the p-value, or the frequency of the GO term in the underlying GOA database.
Figure 5
Figure 5. The “Tag Cloud” view of REVIGO.
All displayed words are overrepresented in the descriptions of the GO terms in the user-supplied list, with larger and darker letters signifying stronger overrepresentation. Underrepresented keywords are not displayed in the Tag Cloud.
Figure 6
Figure 6. REVIGO's “Table” view of seven gene functional categories co-expressed with the human transcription factor ZNF417; data from .
“Frequency” is the percentage of human proteins in UniProt which were annotated with a GO term in the GOA database, i.e. a higher frequency denotes a more general term. Cluster representatives are given in black letters and other cluster members are in gray italics and indented. The seven terms are subdivided into four clusters, two of which contain a single term. The ‘pin’ column can be used to manually override the choice of cluster representative.
Figure 7
Figure 7. REVIGO's “Scatterplot view” of seven gene functional categories co-expressed with the human transcription factor ZNF417; data from , also given in Fig. 6 .
Blue and green bubbles are GO terms with more significant p-values than the orange and red bubbles. The bubbles' x and y coordinates were derived by applying multidimensional scaling to a matrix of the GO terms' semantic similarities; consequently, their closeness on the plot should closely reflect their closeness in the GO graph structure i.e. the semantic similarity. The cluster representatives (see legend of Fig. 6) have their description printed on a dark background, while the other cluster members' descriptions have white backgrounds.

References

    1. Rivals I, Personnaz L, Taing L, Potier M-C. Enrichment or depletion of a GO category within a class of genes: which test? Bioinformatics. 2007;23:401–407. - PubMed
    1. Ashburner M, Ball CA, Blake JA, Botstein D, Butler H, et al. Gene ontology: tool for the unification of biology. The Gene Ontology Consortium. Nat Genet. 2000;25:25–29. - PMC - PubMed
    1. Newman JC, Weiner AM. L2L: a simple tool for discovering the hidden significance in microarray expression data. Genome Biol. 2005;6:R81–R81. - PMC - PubMed
    1. Al-Shahrour F, Minguez P, Tárraga J, Medina I, Alloza E, et al. FatiGO +: a functional profiling tool for genomic data. Integration of functional annotation, regulatory motifs and interaction data with microarray experiments. Nucleic Acids Res. 2007;35:W91–W96. - PMC - PubMed
    1. Eden E, Navon R, Steinfeld I, Lipson D, Yakhini Z. GOrilla: a tool for discovery and visualization of enriched GO terms in ranked gene lists. BMC Bioinformatics. 2009;10:48. - PMC - PubMed

Publication types

Substances