. 2011;6(7):e22138.
doi: 10.1371/journal.pone.0022138. Epub 2011 Jul 15.

Functional diversity of human basic helix-loop-helix transcription factor TCF4 isoforms generated by alternative 5' exon usage and splicing

Affiliations

Functional diversity of human basic helix-loop-helix transcription factor TCF4 isoforms generated by alternative 5' exon usage and splicing

Mari Sepp et al. PLoS One. 2011.

Abstract

Background: Transcription factor 4 (TCF4 alias ITF2, E2-2, ME2 or SEF2) is a ubiquitous class A basic helix-loop-helix protein that binds to E-box DNA sequences (CANNTG). While involved in the development and functioning of many different cell types, recent studies point to important roles for TCF4 in the nervous system. Specifically, human TCF4 gene is implicated in susceptibility to schizophrenia and TCF4 haploinsufficiency is the cause of the Pitt-Hopkins mental retardation syndrome. However, the structure, expression and coding potential of the human TCF4 gene have not been described in detail.

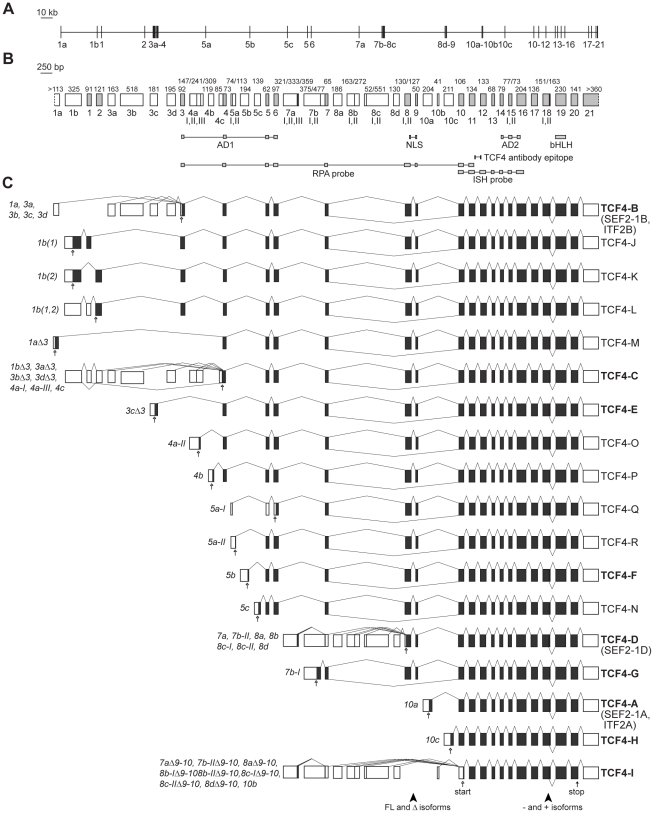
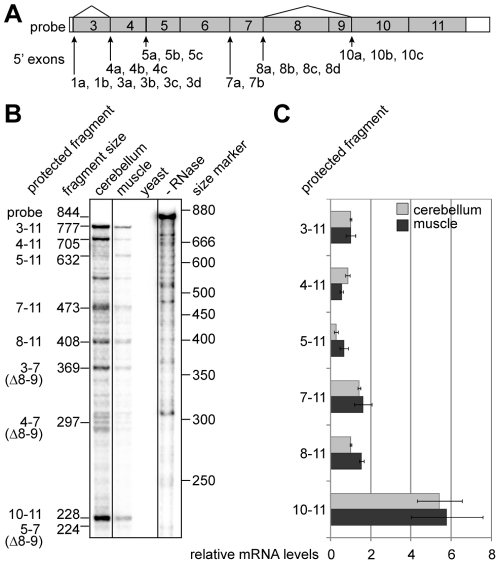
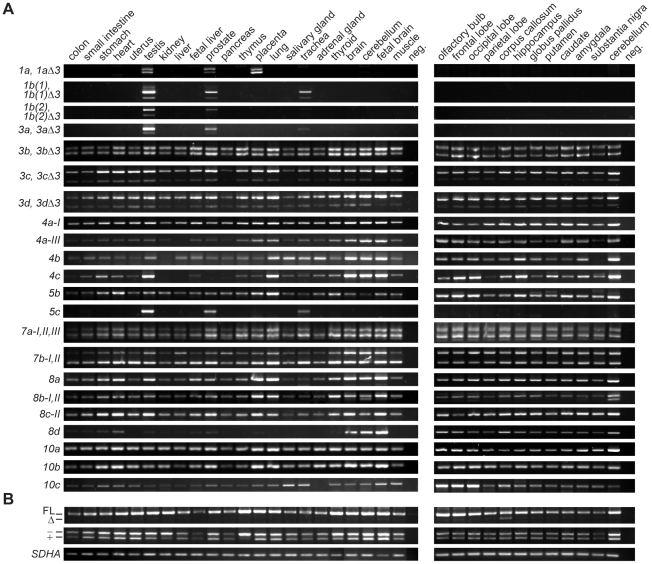
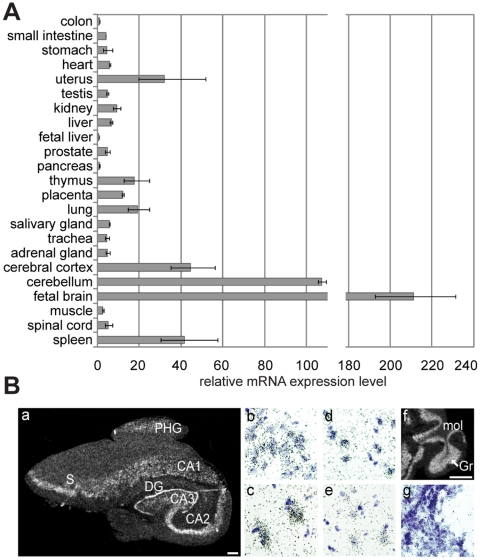
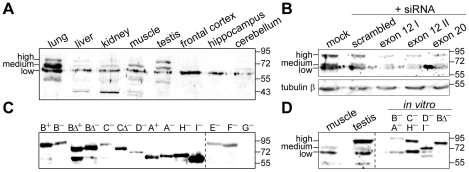
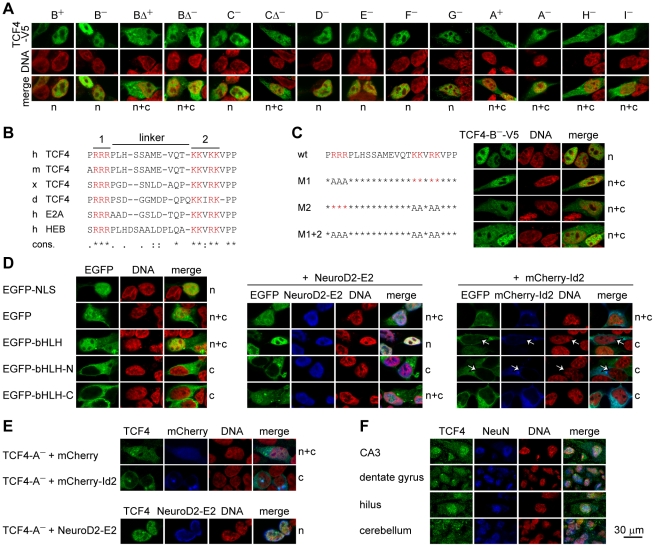
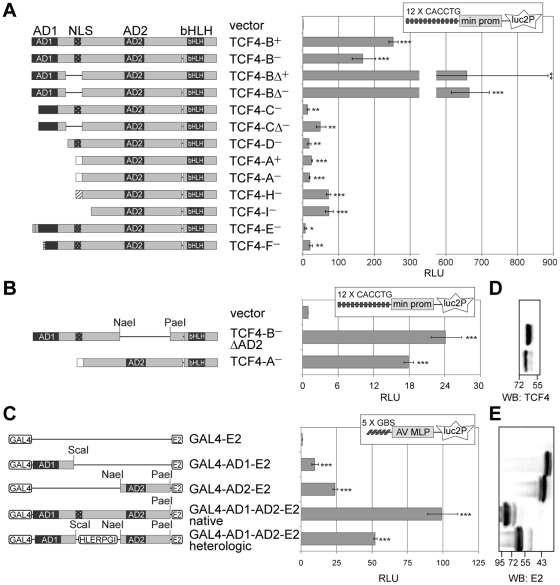
Principal findings: In the present study we used human tissue samples to characterize human TCF4 gene structure and TCF4 expression at mRNA and protein level. We report that although widely expressed, human TCF4 mRNA expression is particularly high in the brain. We demonstrate that usage of numerous 5' exons of the human TCF4 gene potentially yields in TCF4 protein isoforms with 18 different N-termini. In addition, the diversity of isoforms is increased by alternative splicing of several internal exons. For functional characterization of TCF4 isoforms, we overexpressed individual isoforms in cultured human cells. Our analysis revealed that subcellular distribution of TCF4 isoforms is differentially regulated: Some isoforms contain a bipartite nuclear localization signal and are exclusively nuclear, whereas distribution of other isoforms relies on heterodimerization partners. Furthermore, the ability of different TCF4 isoforms to regulate E-box controlled reporter gene transcription is varied depending on whether one or both of the two TCF4 transcription activation domains are present in the protein. Both TCF4 activation domains are able to activate transcription independently, but act synergistically in combination.

Conclusions: Altogether, in this study we have described the inter-tissue variability of TCF4 expression in human and provided evidence about the functional diversity of the alternative TCF4 protein isoforms.


Conflict of interest statement

Competing Interests: The authors have declared that no competing interests exist.

Figures

Figure 1
Figure 1. Structure and alternative splicing of the human TCF4 gene.
TCF4 genomic organization with (A) introns drawn in scale or (B) exons drawn in scale. White boxes mark 5′ exons and light grey boxes represent internal or 3′ exons. Exon names are shown below the boxes. Roman numerals designate alternative splice donor or acceptor sites. Numbers above the exons indicate their sizes in bps. The regions encoding the respective domains of TCF4, the NLS identified in this study and the epitope of the used TCF4 antibody are indicated below the gene structure. Locations of RPA and ISH riboprobes used in this study are also shown. AD, transcription activation domain; bHLH, basic helix-loop-helix domain; NLS, nuclear localization signal; RPA, ribonuclease protection assay; ISH, in situ hybridization. (C) TCF4 alternative transcripts grouped together according to the encoded TCF4 protein isoform. Translated and untranslated regions are indicated as dark grey and white boxes, respectively. Transcripts are designated with the name of the 5′ exon and, if needed, with the number of the splice site used in the 5′ exon. Excluded internal exons are shown with the symbol Δ and included internal exons in parentheses, if necessary. The names of the protein isoforms are shown at the right. The isoforms cloned in this study are brought in bold. The position of the first in-frame start codon for each transcript and stop codon are shown with empty and filled arrows, respectively. Arrowheads at the bottom of the panel point to the regions of alternative splicing giving rise to full-length (FL) and Δ, − and + isoforms.
Figure 2
Figure 2. Initiation of transcription from alternative sites within the TCF4 gene.
(A) Schematic representation of the ribonuclease protection assay probe complementary to TCF4 exons 3–11. Location of the TCF4 5′ exons relative to the probe is shown with arrows and the sites of alternative splicing with lines. (B) Autoradiograph of the probe fragments protected by human cerebellum or muscle RNA and fragments obtained from control reactions with yeast RNA or without RNase treatment. The expected sizes of the protected fragments in bps and the exons they span are shown at the left and the location of the size markers at the right. (C) Densitometric quantification of the protected fragments in B from two assays. The values are given in relation to the levels of the fragment spanning exons 3–11 for both tissues. Error bars indicate standard deviations.
Figure 3
Figure 3. Expression of alternative TCF4 mRNAs in human tissues and brain regions.
(A) RT-PCR analysis of TCF4 transcripts with different 5′ exons and (B) with alternative internal splicing. Transcripts are designated as in Figure 1C. The positions of bands respective to the transcripts encoding the full-length (FL) and Δ isoforms, − and + isoforms are indicated at the left on panel B. mRNAs with longer exon 18 (+) give rise to RT-PCR product that has a unique BglII restriction site enabling discrimination from RT-PCR products amplified from mRNAs not containing the 12 bps insert (−). House-keeping gene SDHA mRNA expression is shown at the bottom of the panel. PCR with no template was performed as a negative control (neg) with each primer pair.
Figure 4
Figure 4. Inter-tissue variability of TCF4 mRNA levels.
(A) Quantitative RT-PCR analysis of TCF4 expression in human tissues. Levels of TCF4 transcripts were determined using three different primer pairs and the results were normalized to the expression levels of four house-keeping genes (SDHA, HMBS, GAPDH and UBC). Shown are the means relative to the TCF4 expression level measured in colon that was arbitrarily set as 1. Error bars indicate standard deviations. (B) In situ hybridization analysis of TCF4 expression in human hippocampus and cerebellum. Autoradiographs from (a) a coronal section of the hippocampus and (f) a sagittal section of the cerebellum are shown. Scale bar 1 mm. Bright-field higher magnification images of emulsion-dipped and hematoxylin-stained sections of (b) the granular cell layer of the dentate gyrus, (c) pyramidal cell layer of the CA2 region, (d) subiculum and (e) PHG region of the cortex. CA1, CA2, CA3, respective regions of the hippocampus; DG, dentate gyrus; Gr, granular cell layer of the cerebellum; mol, molecular layer of the cerebellum; PHG, parahippocampal gyrus; S, subiculum.
Figure 5
Figure 5. Expression of TCF4 protein isoforms.
(A) Western blot analysis of different human tissues and brain regions with TCF4 antibodies. (B) The effect of TCF4 targeting siRNAs on the levels of proteins detected by TCF4 antibodies in extracts of Neuro2A cells. Three different siRNAs specific for TCF4 exon 12 or 20 were transfected into Neuro2A cells; mock and scrambled siRNA transfections were performed in control. Tubulin β levels were determined to demonstrate equal loading. (C) Western blot analysis of TCF4 isoforms overexpressed in HEK293 cells using TCF4 antibodies. (D) Comparison of fractionation of proteins recognized by TCF4 antibodies in human muscle and testis extracts to in vitro translated selected human TCF4 isoforms. The localization of endogenous TCF4 with high, medium or low molecular weight is indicated at the left in A, B and D; the dashed line in C and D separates different exposures; molecular mass (in kDa) marker bands are shown at the right on all panels.
Figure 6
Figure 6. TCF4 intracellular localization.
(A) Immunocytochemical analysis of V5-tagged TCF4 isoforms overexpressed in HEK293 cells. Isoforms analyzed are indicated at the top and localization pattern at the bottom of the panel. n, nuclear; c, cytoplasmic; n+c, nuclear and cytoplasmic. DNA was counterstained with DAPI (pseudocoloured red) to visualize nuclei. (B) Alignment of the identified bipartite NLS in TCF4 of Homo sapiens (h), Mus musculus (m), Xenopus laevis (x) and Danio rerio (d); in E2A and HEB of Homo sapiens. Two clusters of basic amino acids (in red, 1 and 2) and the linker are indicated with lines at the top. Conservation is indicated at the bottom. ‘*’, identity; ‘:’, conserved; ‘.’, semi-conserved substitution. (C) The effect of site-directed mutagenesis of the NLS on the localization of TCF4 in HEK293 cells. Basic amino acids in cluster 1 (M1), 2 (M2) or both (M1+2) were replaced with alanines in the context of TCF4-B-V5 and the localization of the proteins was monitored by immunocytochemistry. (D) Localization of EGFP fusion proteins with TCF4 NLS, bHLH, N-terminal (N) or C-terminal (C) half of TCF4 bHLH domain in HEK293 cells. NeuroD2-E2 or mCherry-Id2 encoding plasmid was cotransfected when indicated. White arrows indicate cells expressing mCherry-Id2. (E) Effect of mCherry-Id2 or NeuroD2-E2 co-expression on subcellular distribution of TCF4-A. The localization patterns of overexpressed TCF4 proteins are indicated at the right of the panels in C, D and E. (F) Immunohistochemical analysis of endogenous TCF4 in human hippocampal and cerebellar sections. NeuN staining was used to identify neurons.
Figure 7
Figure 7. Transcription activation by alternative TCF4 isoforms.
(A) Reporter assay with HEK293 cells transfected with firefly luciferase construct carrying 12 µE5 E-boxes in front of a minimal (min) promoter along with the indicated TCF4 isoform encoding plasmid or an empty vector. (B) Reporter assay with HEK293 cells transfected with luciferase constructs and TCF4-BΔAD2 or TCF4-A encoding plasmid or empty vector as indicated. (C) Reporter assay with HEK293 cells transfected with firefly luciferase construct carrying 5 GAL4 binding sites (GBS) in front of adenovirus major late promoter (AV MLP) along with the indicated E2-tagged GAL4 fusion proteins. (A, B and C) For normalization Renilla luciferase construct with minimal promoter was cotransfected. Luciferase activities were measured and data are presented as fold induced levels above the signals obtained from empty vector transfected cells. Shown are the mean results from at least three independent experiments performed in duplicates, error bars indicate standard deviations. Statistical significance shown with asterisks is relative to the luciferase activity measured from empty vector transfected HEK293 cells (*, p<0.05; **, p<0.01; ***, p<0.001; t-test). RLU, relative luciferase units. Schematic representation of the expressed TCF4 proteins with the locations of restriction enzymes used for the generation of the respective plasmids is shown at the left. (D) Western blot analysis of TCF4-BΔAD2 and TCF4-A expressed in HEK293 cells. (E) Western blot analysis of E2-tagged GAL4 fusion proteins expressed in HEK293 cells. (D and E) Localization of molecular mass (in kDa) marker bands is indicated at the bottom and the order of samples is as in B and C, respectively.

References

    1. Henthorn P, Kiledjian M, Kadesch T. Two distinct transcription factors that bind the immunoglobulin enhancer microE5/kappa 2 motif. Science. 1990;247:467–470. - PubMed
    1. Corneliussen B, Thornell A, Hallberg B, Grundstrom T. Helix-loop-helix transcriptional activators bind to a sequence in glucocorticoid response elements of retrovirus enhancers. J Virol. 1991;65:6084–6093. - PMC - PubMed
    1. Massari ME, Murre C. Helix-loop-helix proteins: regulators of transcription in eucaryotic organisms. Mol Cell Biol. 2000;20:429–440. - PMC - PubMed
    1. Ephrussi A, Church GM, Tonegawa S, Gilbert W. B lineage–specific interactions of an immunoglobulin enhancer with cellular factors in vivo. Science. 1985;227:134–140. - PubMed
    1. Benezra R, Davis RL, Lockshon D, Turner DL, Weintraub H. The protein Id: a negative regulator of helix-loop-helix DNA binding proteins. Cell. 1990;61:49–59. - PubMed

Publication types

MeSH terms

Substances

LinkOut - more resources