. 2011;6(7):e22158.
doi: 10.1371/journal.pone.0022158. Epub 2011 Jul 18.

Histone deacetylase inhibition enhances self renewal and cardioprotection by human cord blood-derived CD34 cells

Affiliations

Histone deacetylase inhibition enhances self renewal and cardioprotection by human cord blood-derived CD34 cells

Ilaria Burba et al. PLoS One. 2011.

Abstract

Background: Use of peripheral blood- or bone marrow-derived progenitors for ischemic heart repair is a feasible option to induce neo-vascularization in ischemic tissues. These cells, named Endothelial Progenitors Cells (EPCs), have been extensively characterized phenotypically and functionally. The clinical efficacy of cardiac repair by EPCs cells remains, however, limited, due to cell autonomous defects as a consequence of risk factors. The devise of "enhancement" strategies has been therefore sought to improve repair ability of these cells and increase the clinical benefit.

Principal findings: Pharmacologic inhibition of histone deacetylases (HDACs) is known to enhance hematopoietic stem cells engraftment by improvement of self renewal and inhibition of differentiation in the presence of mitogenic stimuli in vitro. In the present study cord blood-derived CD34(+) were pre-conditioned with the HDAC inhibitor Valproic Acid. This treatment affected stem cell growth and gene expression, and improved ischemic myocardium protection in an immunodeficient mouse model of myocardial infarction.

Conclusions: Our results show that HDAC blockade leads to phenotype changes in CD34(+) cells with enhanced self renewal and cardioprotection.


Conflict of interest statement

Competing Interests: The authors have declared that no competing interests exist.

Figures

Figure 1
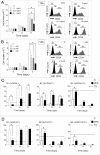
Figure 1. Growth inhibition and stem cell markers (CD34, CD133) expression in control and HDACi-preconditioned stem cells.
(A–B) Time course experiment at 3 and 5 days showing that TSA and VPA dose-dependently inhibited cytokine-induced cellular growth and enhanced the expression of CD34 marker. R1, R2 and R3 represent the three regions corresponding to CD34neg, CD34dim and CD34bright cells, respectively, as detected by flow cytometry. (C–D) Quantification of CD34neg, CD34dim, CD34bright cells and CD133neg, CD133dim and CD133bright cells at 5, 14 and 21 days of culture in the presence or the absence of 2.5 mM VPA by flow cytometry. * indicate P<0.05 by 2 ways ANOVA with Bonferroni post-hoc analysis (n≥4).
Figure 2
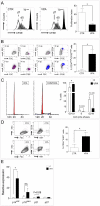
Figure 2. Analysis of CD34+ cells proliferation in the presence and the absence of VPA by flow cytometry.
(A) CFSE staining profiles of control and VPA-treated cells at 5 and 7 days of culture. Note that the fluorescence intensity reduction as a consequence in cell proliferation was less pronounced in VPA vs. CTR cells at both time points. Proliferation index at 7 days was significantly reduced. (B) Seven days VPA treated cells had a higher frequency of slow dividing immature (CD34bright) stem cells (blue area in contour plots), as detected by co-staining with CFSE and CD34 antibody; plots on the left indicate the fluorescence profile of cells stained with CFSE and CD34 isotype antibody (iso). (C) Cell cycle analysis in 7 days CTR and VPA-treated cells revealed a higher frequency of cells in the G0–G1 and a lower percentage in either S and G2-M phases. (D) The percentage of cells specifically arrested in G0 was also increased, as detected by co-staining with anti Ki67 and CD34 antibodies at the same time point. * indicate P<0.05 by paired t-test (n≥3). (E) Quantification of the relative expression level (2−ΔΔCt method) of small cyclin/CDK inhibitors (p14ARF, p16INK4, p21Cip1/waf1 and p27) by qRT-PCR analysis. * indicates P<0.05 by unpaired t-test (n≥3).
Figure 3
Figure 3. Effect of VPA is directly related to HDAC inhibition.
(A) The VPA structural analogue Valpromide (VPM) reduced CD34+ cells proliferation at lower extent compared to continuous treatment with VPA in a 5 day time course experiment. By contrast, the CD34 expression profile was identical to that of control cells, as detected by flow cytometry. (B) Western blotting showing that a 7 day VPA treatment induced hyper acethylation on H4 and H3 (at lysine residue 9) histones. * indicate P<0.05 by two ways ANOVA with Bonferroni post hoc analysis (n≥3). (C) Representative ChIP experiment showing an increased enrichment of various sites in the CD34 gene promoter (upstream and downstream of the TSS), as a result of chromatin hyper-acetylation (pan-H4Ac, H3K9Ac) due to VPA treatment. Data are expressed as relative enrichment calculated by real time PCR amplification.
Figure 4
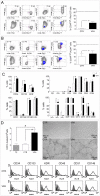
Figure 4. Phenotype and stem cell function in control and 7-days VPA treated cells by flow cytometry.
(A) quantification of cells actively extruding Rhodamine123 dye as a result of ABCG2 gene product MDR-1, a typical activity of immature stem cells. Contour plots on the left show the staining profile in the presence of the MDR-1 pump inhibitor Verapamil, plus the CD34 isotype (ISO), while those on the right show the shift toward the left of a CD34bright cells fraction (blue area) in VPA-treated cells (V). Bar graph on the right indicates quantification of CD34bright/Rho123lo cells in C and VPA conditions; dotted line indicate the percentage of CD34bright/Rho123lo cells immediately after isolating CD34+ cells from cord blood. (B) Quantification of ALDH expressing cells. Contour plots on the left show the fluorescence profile of cells treated with the ALDH inhibitor DEAB (used as a negative control) and CD34 isotype antibody (i+D), while those on the right show the results of specific staining with CD34 antibody and fluorescent detection of ALDH activity. Note that in the presence of VPA a higher percentage of CD34bright/ALDH+ cells was present (blue area), while in control cells ALDH staining was lower in the CD34bright gating and present in CD34dim/neg cells (areas in magenta color). Bar graph on the right indicates quantification of CD34bright/ALDH+ cells in C and VPA conditions; dotted line indicate the percentage of these cells immediately after isolating CD34+ cells from cord blood. * indicate P<0.05 by paired t-test (n = 4). (C) phenotype analysis of control and VPA cells at 7 days of culture by multiparametric flow cytometry experiments. Upregulation of stem cells markers CD34, CD133, CD38 and KDR were found along with enhanced expression of mesenchymal markers CD90, CD146 and CD130. Consistent with an effect of VPA on myeloid differentiation inhibition, CD14 was inhibited. * indicate P<0.05 by paired t-test (n≥3). (D) Derivation of ECFCs from fresh, CTR and VPA CD34+ cells. Formation of clusters was observed three weeks after plating these cells onto FN coated dishes. Histogram represents number of ECFC clusters observed in three independent experiments; * indicates P<0.05 by one way ANOVA with Neuman Keuls post-hoc. Pictures on the upper right show the morphology of ECFCs derived from CTR and VPA CD34+ cells and their ability to form capillary-like structures, when plated onto matrigel. The amount of these latter structures formed by either CTR or VPA cells was not different compared with HUVEC cells that were used as a positive control (not shown). Plots in the lower part of the panel show expression of typical ECFC markers .
Figure 5
Figure 5. Unsupervised hierarchical cluster analysis and statistical analysis of mRNA and miRNA profiling in CTR vs. 7 days VPA treated CD34+ cells (A and B, respectively).
The analyses were performed initially using the whole datasets of genes (panel A, left heat map) or miRNAs (panel B, left heat map) that passed the quality assurance and filtering criteria (see Supplementary Methods), to assess whether expression profiles discriminates treatment groups. A second round of unsupervised hierarchical clustering was done on differentially expressed genes (panel B, right heat map) or miRNAs (panel C, right heat map), as selected by significance analysis (see Supplementary Methods), to identify biologically relevant co-expressed gene clusters. The mean centered level of expression of each gene/miRNA in each sample is represented with green, black, and red colour scales (green indicates below mean; black, equal to mean; and red, above mean). The dendrograms on top of each heat map display the unsupervised clustering of control and VPA-treated CD34+ cells using the whole or the differentially expressed gene/miRNA lists. The dendrograms on the left side of each heat map show the unsupervised clustering of the genes. Correlation coefficients are reported for both. See Supplementary Methods for data transformation and adjustments, distance metrics and linkage methods.
Figure 6
Figure 6. Effect of 7 days cultured CTR and VPA-treated CD34+ cells on survival, left ventricle function neo-vascularization and ventricular remodeling in an immunodeficient mouse model of myocardial infarction.
(A) Mortality Kaplan-Meier curve of sham operated, saline-injected, control and VPA CD34+ cells-injected mice. The mortality in mice injected with VPA-treated CD34+ cells was not significantly different from that of sham operated mice (see enclosed table). Significance calculated by log-rank (Mantel-Cox) test. (B) Echocardiographic assessment of ejection fraction, left ventricular end-diastolic and end-systolic volumes showed an improved ventricular function in VPA treated CD34+ cells, but not in control CD34+ cells-injected animals. (C) Representative images of transversal sections of diastole-arrested hearts, used to evaluate the infarct scar size and LV morphometric values. * indicate P<0.05 by one way ANOVA with Newman Keuls post hoc analysis (n≥7). (D) Representative images of Rhodamine-labeled Griffonia simplicifolia Lectin 1 staining of LV histological sections for capillary density determination. The bar graph indicates the density of these vessels at the infarct border zone.
Figure 7
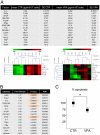
Figure 7. Enhanced cytokine release and higher hypoxia suppression by 7 days VPA-treated CD34+ cells conditioned medium.
(A) Analysis of pro-inflammatory and pro-angiogenic factors present in the control and VPA-treated CD34+ cells secretome. Table shows means and standard error of each cytokine released in the culture supernatants. Heat maps indicate a treatment-related coherent upregulation of most of the secreted factors in four independent CD34+ cells samples. (B) Statistical analysis of the cytokine concentrations in culture supernatants by paired t-test. The fold change in the release of these cytokines from VPA-treated vs. CTR CD34+ cells is shown. With the exception of Leptin, IL-8, VEGF, and bFGF (orange color), all the other cytokines were significantly up-regulated in HDACi preconditioned cells, indicating an enhancement of their paracrine effect. (C) Effect of CTR and VPA CD34+ cells conditioned medium on rescue from apoptosis of HL-1 cardiomyocytes cell line exposed to hypoxia conditions. Data in the graph represent the percent variation in apoptotic death of HL-1 cells exposed to hypoxia in the presence of VPA treated CD34+ cells conditioned medium in comparison with medium conditioned by CTR cells; * indicate P<0.05 by paired t-test (n = 5).
Figure 8
Figure 8. Effect of VPA and CTR cells on myocardial healing.
(A) Representative images of α-SMA staining (red fluorescence) of the infarct zone to reveal the presence of myo-fibroblasts. (B) Representative low and high power views of picrosirius red staining of the myocardium to reveal the collagen deposition. Pictures on the right show polarized light imaging of the same microscopic fields in the center of the panel, to show that birefringence of collagen bundles was not affected by saline or CTR and VPA CD34+ cells treatments. (C–D) Quantification of Collagen deposition and myofibroblasts. Collagen data are shown as percentage of the areas containing collagen normalized to total area sections, while myofibroblasts were determined by counting the number of α-SMA+ cells in the infarct zone (n≥6). Statistical analysis of these data by one-way ANOVA with Newman-Keuls post-hoc test did not reveal differences between treatment groups, although lower amount of Collagen and smaller myofibroblasts number were found in VPA cells-injected mice.

Similar articles

Cited by

References

    1. Asahara T, Murohara T, Sullivan A, Silver M, van der Zee R, et al. Isolation of putative progenitor endothelial cells for angiogenesis. Science. 1997;275:964–967. - PubMed
    1. Rossig L, Urbich C, Dimmeler S. Endothelial progenitor cells at work: not mature yet, but already stress-resistant. Arterioscler Thromb Vasc Biol. 2004;24:1977–1979. - PubMed
    1. Vasa M, Fichtlscherer S, Aicher A, Adler K, Urbich C, et al. Number and migratory activity of circulating endothelial progenitor cells inversely correlate with risk factors for coronary artery disease. Circ Res. 2001;89:E1–7. - PubMed
    1. Seeger FH, Zeiher AM, Dimmeler S. Cell-enhancement strategies for the treatment of ischemic heart disease. Nat Clin Pract Cardiovasc Med. 2007;4(Suppl 1):S110–113. - PubMed
    1. Burba I, Devanna P, Pesce M. When cells become a drug. Endothelial progenitor cells for cardiovascular therapy: aims and reality. Recent Pat Cardiovasc Drug Discov. 2010;5:1–10. - PubMed

Publication types

MeSH terms