

Food web architecture and basal resources interact to determine biomass and stoichiometric cascades along a benthic food web
- PMID: 21789234
- PMCID: PMC3138757
- DOI: 10.1371/journal.pone.0022205
Food web architecture and basal resources interact to determine biomass and stoichiometric cascades along a benthic food web
Abstract
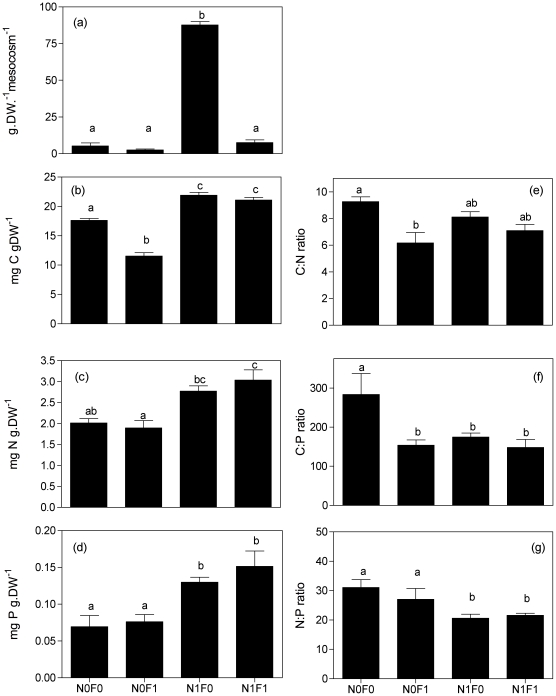
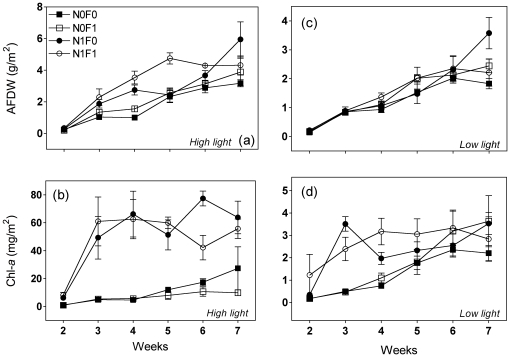
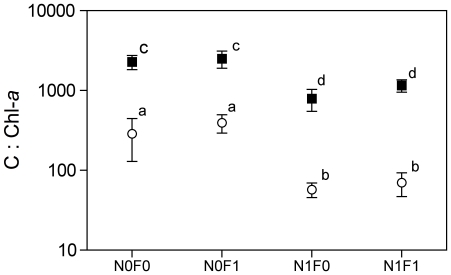
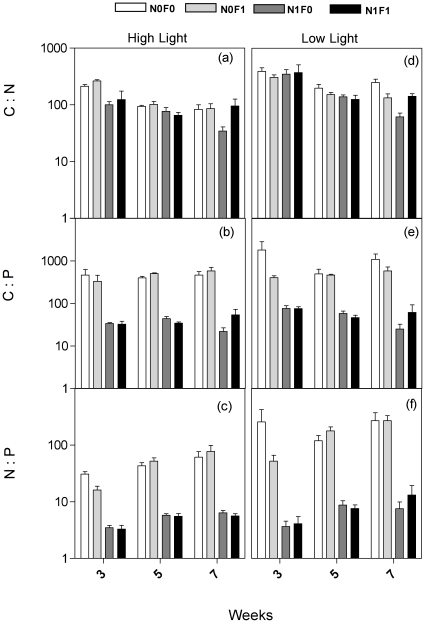
Understanding the effects of predators and resources on primary producers has been a major focus of interest in ecology. Within this context, the trophic cascade concept especially concerning the pelagic zone of lakes has been the focus of the majority of these studies. However, littoral food webs could be especially interesting because base trophic levels may be strongly regulated by consumers and prone to be light limited. In this study, the availability of nutrients and light and the presence of an omnivorous fish (Hyphessobrycon bifasciatus) were manipulated in enclosures placed in a humic coastal lagoon (Cabiúnas Lagoon, Macaé - RJ) to evaluate the individual and interactive effects of resource availability (nutrients and light) and food web configuration on the biomass and stoichiometry of periphyton and benthic grazers. Our findings suggest that light and nutrients interact to determine periphyton biomass and stoichiometry, which propagates to the consumer level. We observed a positive effect of the availability of nutrients on periphytic biomass and grazers' biomass, as well as a reduction of periphytic C∶N∶P ratios and an increase of grazers' N and P content. Low light availability constrained the propagation of nutrient effects on periphyton biomass and induced higher periphytic C∶N∶P ratios. The effects of fish presence strongly interacted with resource availability. In general, a positive effect of fish presence was observed for the total biomass of periphyton and grazer's biomass, especially with high resource availability, but the opposite was found for periphytic autotrophic biomass. Fish also had a significant effect on periphyton stoichiometry, but no effect was observed on grazers' stoichiometric ratios. In summary, we observed that the indirect effect of fish predation on periphyton biomass might be dependent on multiple resources and periphyton nutrient stoichiometric variation can affect consumers' stoichiometry.
Conflict of interest statement
Figures
References
-
- Gruner DS, Smith JE, Seabloom EW, Sandin Sa, Ngai JT, et al. A cross-system synthesis of consumer and nutrient resource control on producer biomass. Ecology letters. 2008;11:740–755. - PubMed
-
- Power ME. Top-down and bottom-up forces in food webs: do plants have primacy. Ecology. 1992;73:733–746.
-
- Vadeboncoeur Y, Vander-Zanden MJ, Lodge DM. Putting the lake back together: reintegrating benthic pathways into lake food web models. Bioscience. 2002;42:44–55.
-
- Brönmark C. Effects of tench and perch on interactions in a freshwater, benthic food chain. Ecology. 1994;75:1818–1828.
-
- McCollum EW, Crowder LB, McCollum SA. Complex interactions of fish, snails, and littoral zone periphyton. Ecology. 1998;79:1980–1994.
Publication types
MeSH terms
Substances
LinkOut - more resources
Full Text Sources
