

Community structure in social networks: applications for epidemiological modelling
- PMID: 21789238
- PMCID: PMC3138783
- DOI: 10.1371/journal.pone.0022220
Community structure in social networks: applications for epidemiological modelling
Abstract
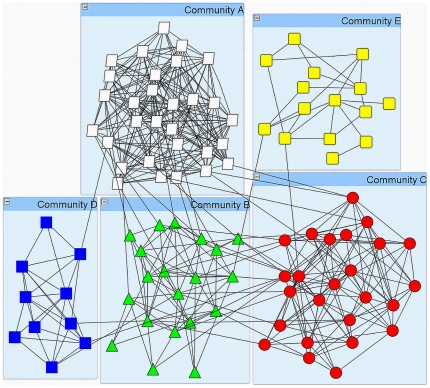
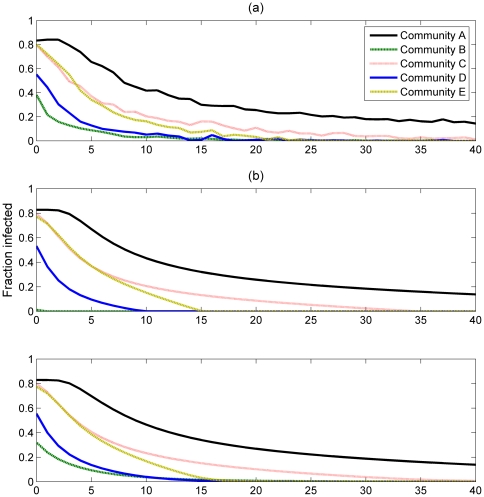
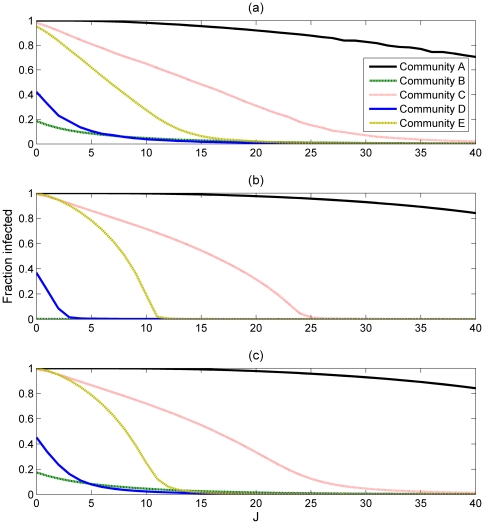
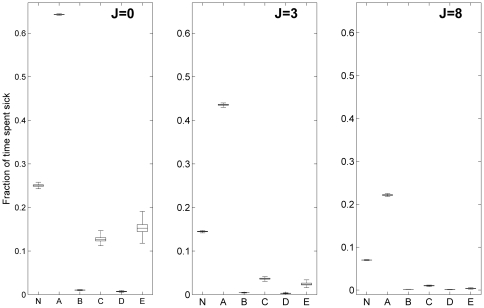
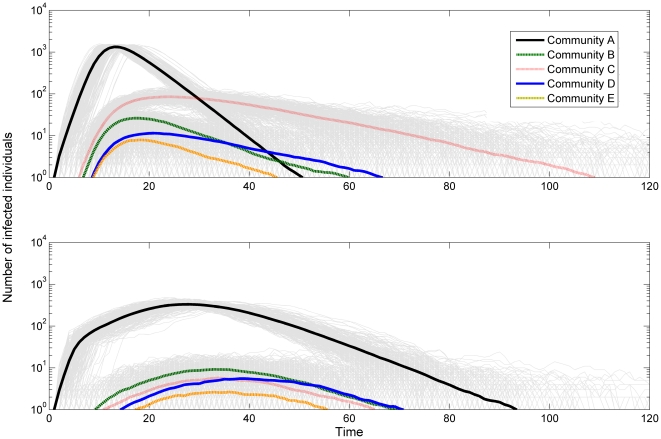
During an infectious disease outbreak people will often change their behaviour to reduce their risk of infection. Furthermore, in a given population, the level of perceived risk of infection will vary greatly amongst individuals. The difference in perception could be due to a variety of factors including varying levels of information regarding the pathogen, quality of local healthcare, availability of preventative measures, etc. In this work we argue that we can split a social network, representing a population, into interacting communities with varying levels of awareness of the disease. We construct a theoretical population and study which such communities suffer most of the burden of the disease and how their awareness affects the spread of infection. We aim to gain a better understanding of the effects that community-structured networks and variations in awareness, or risk perception, have on the disease dynamics and to promote more community-resolved modelling in epidemiology.
Conflict of interest statement
Figures
Similar articles
-
The spread of awareness and its impact on epidemic outbreaks.Proc Natl Acad Sci U S A. 2009 Apr 21;106(16):6872-7. doi: 10.1073/pnas.0810762106. Epub 2009 Mar 30. Proc Natl Acad Sci U S A. 2009. PMID: 19332788 Free PMC article.
-
Networks and epidemic models.J R Soc Interface. 2005 Sep 22;2(4):295-307. doi: 10.1098/rsif.2005.0051. J R Soc Interface. 2005. PMID: 16849187 Free PMC article. Review.
-
Epidemic spreading in time-varying community networks.Chaos. 2014 Jun;24(2):023116. doi: 10.1063/1.4876436. Chaos. 2014. PMID: 24985430 Free PMC article.
-
Complex social contagion makes networks more vulnerable to disease outbreaks.Sci Rep. 2013;3:1905. doi: 10.1038/srep01905. Sci Rep. 2013. PMID: 23712758 Free PMC article.
-
A rigorous approach to investigating common assumptions about disease transmission: Process algebra as an emerging modelling methodology for epidemiology.Theory Biosci. 2011 Mar;130(1):19-29. doi: 10.1007/s12064-010-0106-8. Epub 2010 Aug 31. Theory Biosci. 2011. PMID: 20809367 Review.
Cited by
-
Modeling and analysis of epidemic spreading on community networks with heterogeneity.J Parallel Distrib Comput. 2018 Sep;119:136-145. doi: 10.1016/j.jpdc.2018.04.009. Epub 2018 Apr 27. J Parallel Distrib Comput. 2018. PMID: 32288171 Free PMC article.
-
Link removal for the control of stochastically evolving epidemics over networks: a comparison of approaches.J Theor Biol. 2015 Apr 21;371:154-65. doi: 10.1016/j.jtbi.2015.02.005. Epub 2015 Feb 16. J Theor Biol. 2015. PMID: 25698229 Free PMC article.
-
Cultural change beyond adoption dynamics: Evolutionary approaches to the discontinuation of contraception.Evol Hum Sci. 2021 Feb 9;3:e13. doi: 10.1017/ehs.2021.8. eCollection 2021. Evol Hum Sci. 2021. PMID: 37588536 Free PMC article. Review.
-
Behavioural change models for infectious disease transmission: a systematic review (2010-2015).J R Soc Interface. 2016 Dec;13(125):20160820. doi: 10.1098/rsif.2016.0820. J R Soc Interface. 2016. PMID: 28003528 Free PMC article.
-
Towards multiscale modeling of influenza infection.J Theor Biol. 2013 Sep 7;332:267-90. doi: 10.1016/j.jtbi.2013.03.024. Epub 2013 Apr 19. J Theor Biol. 2013. PMID: 23608630 Free PMC article.
References
-
- Ferguson N. Capturing human behaviour. Nature. 2007;429:180–184. - PubMed
-
- Anderson RM, May RM. Infectious Diseases of Humans: Dynamics and Control. Oxford: Oxford University Press; 1991.
-
- Kermack WO, McKendrick AG. A Contribution to the Mathematical Theory of Epidemics. Proc R Soc Lond A. 1927;115:700–721.
-
- Hanski I. Metapopulation dynamics. Nature. 1998;396:41–49.
Publication types
MeSH terms
LinkOut - more resources
Full Text Sources
