. 2011;6(7):e22264.
doi: 10.1371/journal.pone.0022264. Epub 2011 Jul 18.

Energy metabolism in H460 lung cancer cells: effects of histone deacetylase inhibitors

Affiliations

Energy metabolism in H460 lung cancer cells: effects of histone deacetylase inhibitors

Nívea Dias Amoêdo et al. PLoS One. 2011.

Abstract

Background: Tumor cells are characterized by accelerated growth usually accompanied by up-regulated pathways that ultimately increase the rate of ATP production. These cells can suffer metabolic reprogramming, resulting in distinct bioenergetic phenotypes, generally enhancing glycolysis channeled to lactate production. In the present work we showed metabolic reprogramming by means of inhibitors of histone deacetylase (HDACis), sodium butyrate and trichostatin. This treatment was able to shift energy metabolism by activating mitochondrial systems such as the respiratory chain and oxidative phosphorylation that were largely repressed in the untreated controls.

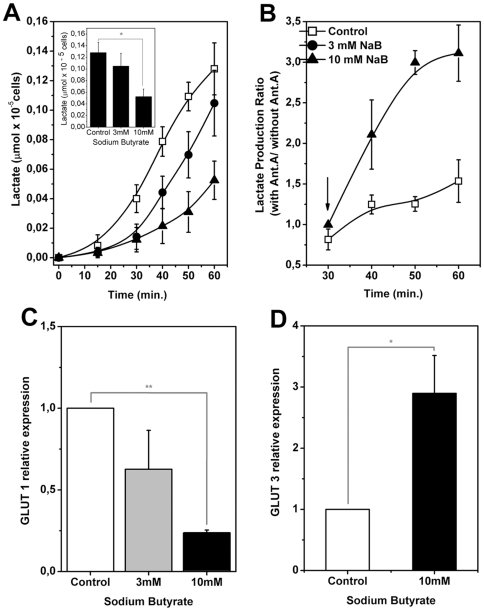
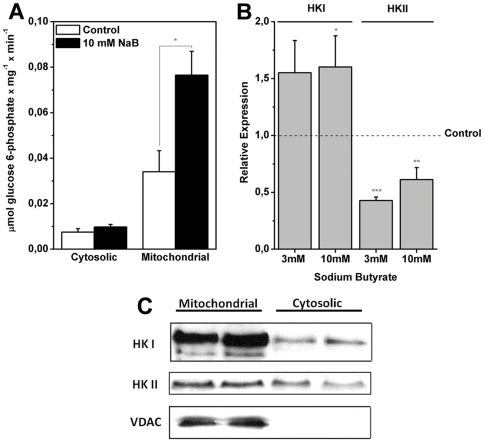
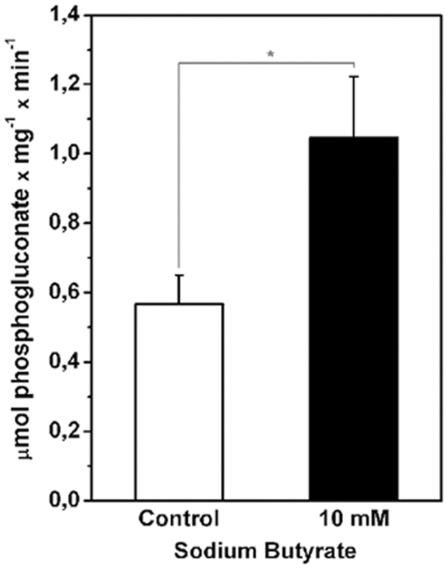
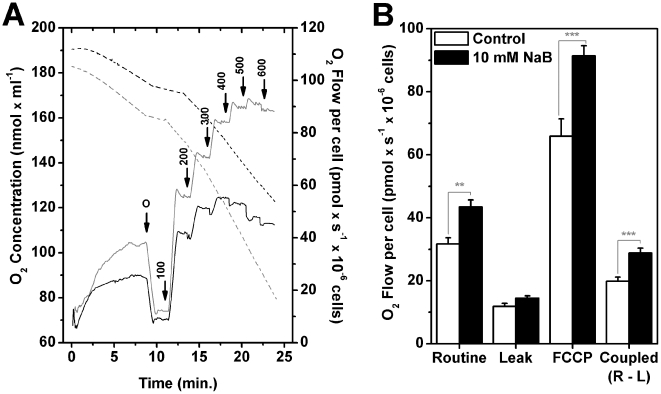
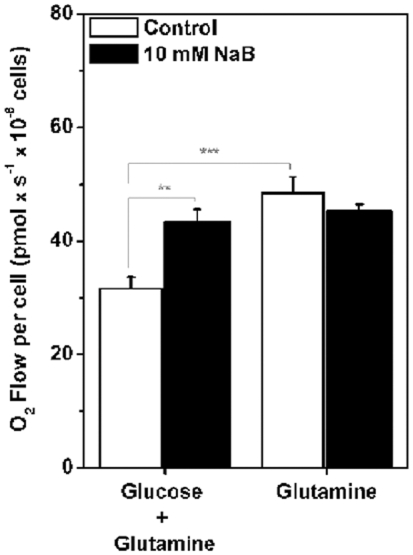
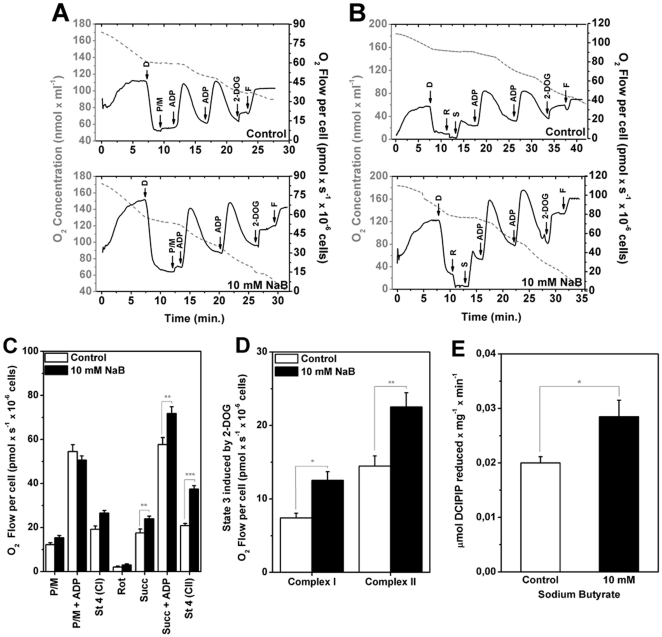
Methodology/principal findings: Various cellular and biochemical parameters were evaluated in lung cancer H460 cells treated with the histone deacetylase inhibitors (HDACis), sodium butyrate (NaB) and trichostatin A (TSA). NaB and TSA reduced glycolytic flux, assayed by lactate release by H460 cells in a concentration dependent manner. NaB inhibited the expression of glucose transporter type 1 (GLUT 1), but substantially increased mitochondria bound hexokinase (HK) activity. NaB induced increase in HK activity was associated to isoform HK I and was accompanied by 1.5 fold increase in HK I mRNA expression and cognate protein biosynthesis. Lactate dehydrogenase (LDH) and pyruvate kinase (PYK) activities were unchanged by HDACis suggesting that the increase in the HK activity was not coupled to glycolytic flux. High resolution respirometry of H460 cells revealed NaB-dependent increased rates of oxygen consumption coupled to ATP synthesis. Metabolomic analysis showed that NaB altered the glycolytic metabolite profile of intact H460 cells. Concomitantly we detected an activation of the pentose phosphate pathway (PPP). The high O(2) consumption in NaB-treated cells was shown to be unrelated to mitochondrial biogenesis since citrate synthase (CS) activity and the amount of mitochondrial DNA remained unchanged.

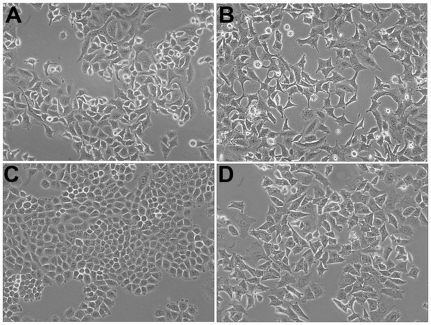
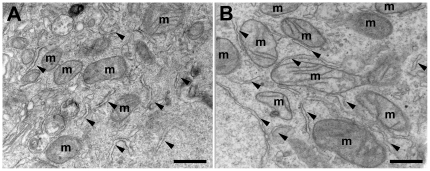
Conclusion: NaB and TSA induced an increase in mitochondrial function and oxidative metabolism in H460 lung tumor cells concomitant with a less proliferative cellular phenotype.


Conflict of interest statement

Competing Interests: The authors have declared that no competing interests exist.

Figures

Figure 1
Figure 1. Sodium butyrate induces morphological changes and cell cycle arrest in H460 cells.
The cells were incubated at 37°C humidified incubator containing 5% CO2 and photographed under bright field using the documentation system of inverted microscope Nikon TS100. (A) A549 cells non-treated. (B) A549 cells treated with 10 mM NaB for 24 h. (C) H460 cells. (D) H460 cells treated with 10 mM NaB for 24 h.
Figure 2
Figure 2. Sodium butyrate reduces lactate production and regulates glucose transporter isoform 1 (GLUT 1) and 3 (GLUT 3) expression.
After 24 h of treatment with 3 mM or 10 mM NaB, H460 cells were incubated with glucose-supplemented medium. Aliquots of supernatants were collected every 10 minutes and incubated in hidrazine buffer pH 9.2, with an excess of NAD+ and lactate dehydrogenase (LDH) for measurement of lactate released. (A) Kinetics of lactate release and representation of lactate release after 60 minutes (inset). (B) After 30 minutes of incubation with glucose, 2 µg/ml antimycin A was added to the culture. Aliquots of the supernatant were taken at 10 minutes intervals and lactate released was measured. The lactate production ratio of H460 cells in the presence and absence of antimycin A evidences the stimulation on lactate production when oxidative phosphorylation was inhibited by the addition of this drug (indicated by the black arrow). Values represent mean ± SEM; N = 4, *P<0.05. (C) Cells were treated with 3 mM or 10 mM NaB for 24 h and GLUT 1 and (D) GLUT 3 expression was determined by Real Time PCR. Actin was used to normalize cDNA amounts. Values represent mean ± SEM; N = 3, *P<0.05; **P<0.01.
Figure 3
Figure 3. Treatment of H460 cells with sodium butyrate increases mitochondria bound hexokinase (mt-HK) activity and expression.
(A) Specific HK activity present in cytosolic and mitochondrial fractions of H460 cells treated or not with 10 mM NaB was assayed using an enzymatic assay coupled to glucose 6-phosphate dehydrogenase. Values represent mean ± SEM; N = 4, *P<0.05. (B) Relative HK I and HK II expression was determined by real time PCR. (C) Western-Blot using anti-HK I, HK II and VDAC primary antibodies. Values represent mean ± SEM; N = 3, *P<0.05; **P<0.01; ***P<0.001.
Figure 4
Figure 4. Treatment with sodium butyrate induces an increase in specific glucose-6-phosphate dehydrogenase (G6PDH) activity.
H460 cells were treated with 10 mM NaB for 24 h and specific G6PDH activity present in cytosolic fraction was assayed as described under “Experimental Procedures”. Values represent mean ± SEM; N = 5, *P<0.05.
Figure 5
Figure 5. High-resolution respirometry shows an increase in oxidative metabolism subsequent to treatment with sodium butyrate.
(A) Representative record of oxygen concentration and flow of intact H460 cells treated or not with 10 mM NaB for 24 h. During the assay, cells were maintained in RPMI medium with glucose and without FBS. Black dashed line represents oxygen concentration in control cells and gray dashed line in NaB treated ones. Black solid line represents oxygen flow in control cells and gray solid line in NaB treated ones. “O” 1 µg/mL oligomycin; “arrows” indicate the titration of FCCP (nM). (B) Effect of NaB treatment on respiratory parameters of intact H460 cells. Routine respiration - basal respiration of H460 intact cells; Leak respiration - rate of oxygen consumption after the addition of oligomycin, that is, respiration not coupled to ATP synthesis; FCCP - maximum respiratory capacity (induced by the addition of FCCP); Coupled respiration - respiration coupled to ATP synthesis, obtained by subtraction of Leak from Routine respiration. Values represent mean ± SEM; N = 9, **P<0.01; ***P<0.001.
Figure 6
Figure 6. The crabtree effect is not observed in H460 cells after sodium butyrate treatment.
After treatment with 10 mM NaB for 24 h, H460 cells oxygen flow was measured on DMEM medium with or without glucose containing 2 mM glutamine as respiratory substrate. This result confirms the stronger oxidative metabolic profile of H460 cells treated with NaB. Values represent mean ± SEM; N = 5, **P<0.01; ***P<0.001.
Figure 7
Figure 7. Sodium butyrate treatment increases oxygen consumption when succinate is used as respiratory substrate.
H460 cells were treated with NaB for 24 h, permeabilized with 0.003% digitonin “D” and oxygen flow or concentration were measured using high-resolution respirometry on respiration buffer. The substrates and/or modulators were added in the following order: 10 mM pyruvate + malate “P/M”, 100 µM ADP, 100 µM ADP, 10 mM 2-deoxy-D-glucose “2-DOG” and 200 µM FCCP “F” or 1 µM rotenone “R”, 10 mM succinate “S”, 100 µM ADP, 100 µM ADP, 10 mM 2-deoxy-D-glucose “2-DOG” and 200 µM FCCP “F”. (A) and (B) Representative assays of oxygen concentration (gray dashed line) and oxygen flow (black solid line) of permeabilized H460 cells. (C) Rate of O2 flow per cell after addition of the different substrates and/or modulators. Values represent mean ± SEM (N = 7 – Control; N = 10–10 mM NaB). **P<0.01; ***P<0.0001. (D) Hexokinase bound mitochondria activity stimulates oxygen consumption in NaB treated H460 cells. The stimulus of oxygen consumption was measured as the difference between O2 flow per cell in presence of glucose analogue 2-deoxy-D-glucose (2-DOG) and in the absence of ATP synthesis (state 4), in a high-resolution oxygraph. Values were expressed as mean ± SEM. N = 7, * P<0.05; **P<0.01. (E) Specific SDH activity present in mitochondrial fraction of H460 cells treated or not with 10 mM NaB was assayed using an enzymatic assay based on the PMS-mediated reduction of DCPIP. Values were expressed as mean ± SEM. N = 6, * P<0.05.
Figure 8
Figure 8. Sodium butyrate treatment alters mitochondria structure in H460 cells.
Electron microscopy of longitudinal sections of (A) H460 cells control and (B) treated with 10 mM NaB for 24 h. Bars: 1 µm. Arrowheads show the proximity between endoplasmic reticulum and mitochondria.
Figure 9
Figure 9. Metabolomics profile by NMR spectroscopy.
(A) Control H460 cells or (B) cells treated for 24 h with 10 mM NaB were incubated in DMEM containing 13C-glucose. After the incubation, cells were harvested, and intact cells were analyzed by NMR spectroscopy. Spectra highlight the enrichment of the following 13C-containing informative metabolic intermediates: (1) Oxoglutaric acid; (2) Citric acid; (3) Fumaric acid; (4) L- Asparagine; (5) L-Glutamic acid; (6) L-Lysine; (7) L-Leucine; (8) 5-Methylcytidine; (9) 5-Methyldeoxycytidine; (10) Uridine; (11) Deoxyinosine; (12) Deoxyguanosine; (13) Coenzyme A; (14) 2-Acetolactate; (15) dGDP; (16) dGTP; (17) NAD; (18) NADPH; (19) NADP; (20) Phosphoribosyl pyrophosphate (PRPP); (21) Sedoheptulose 7-phosphate; (22) Xylulose 5-phosphate; (23) Fructose 6-phosphate; (24) Gluconolactone; (25) Cytidine triphosphate; (26) Cytidine monophosphate; (27) 2-Phospho-glyceric acid; (28) Glucose 6-phosphate; (29) 6-Phosphonoglucono-lactone; (30) Glyceric acid 1,3-biphosphate, (31) Malic acid; (32) 6-Phosphogluconic acid; (33) Erythrose 4-phosphate; (34) Ribulose 5-phosphate; (35) Acetoacetic acid; (36) L-Glutamine; (37) L-Cysteine; (38) L-lactate; (39) L-Alanine.

References

    1. Warburg O. On respiratory impairment in cancer cells. Science. 1956;124:269–270. - PubMed
    1. Crabtree HG. Observations on the carbohydrate metabolism of tumours. Biochem J. 1929;23:536–545. - PMC - PubMed
    1. Annibaldi A, Widmann C. Glucose metabolism in cancer cells. Curr Opin Clin Nutr Metab Care. 2010;13:466–470. - PubMed
    1. Vander Heiden MG, Cantley LC, Thompson CB. Understanding the Warburg effect: the metabolic requirements of cell proliferation. Science. 2009;324:1029–1033. - PMC - PubMed
    1. Semenza GL. HIF-1: upstream and downstream of cancer metabolism. Curr Opin Genet Dev. 2010;20:51–56. - PMC - PubMed

Publication types

MeSH terms