. 2012 Dec;7(4):843-55.
doi: 10.1007/s11481-011-9293-4. Epub 2011 Jul 26.

Δ9-tetrahydrocannabinol suppresses cytotoxic T lymphocyte function independent of CB1 and CB 2, disrupting early activation events

Affiliations

Δ9-tetrahydrocannabinol suppresses cytotoxic T lymphocyte function independent of CB1 and CB 2, disrupting early activation events

Peer W F Karmaus et al. J Neuroimmune Pharmacol. 2012 Dec.

Abstract

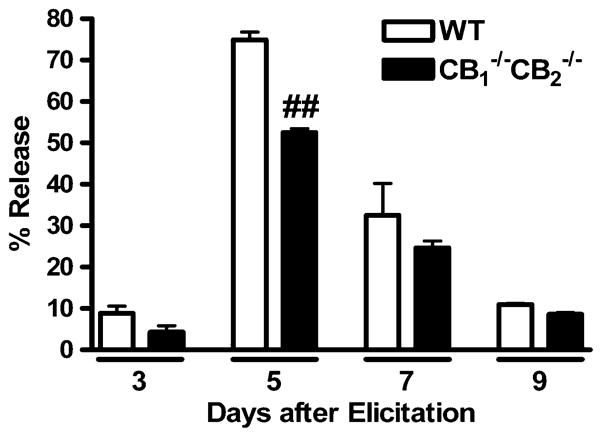
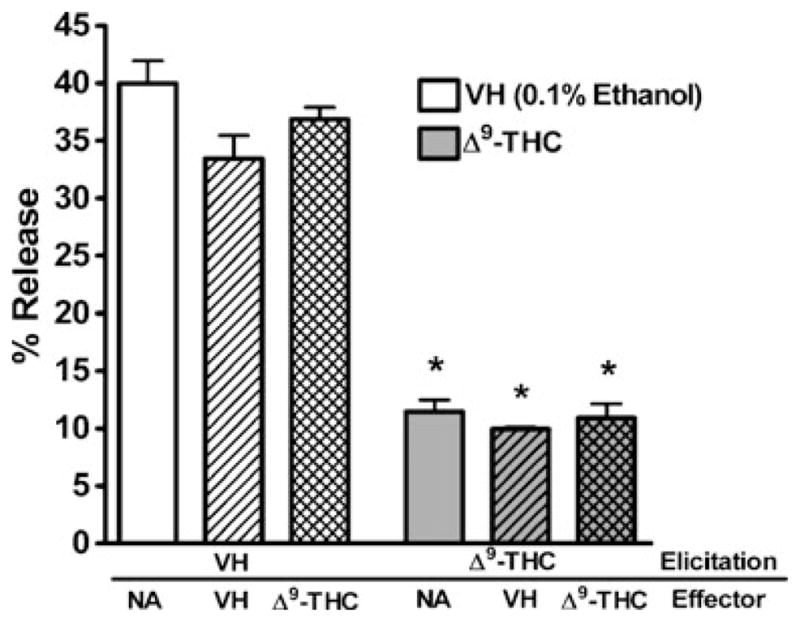
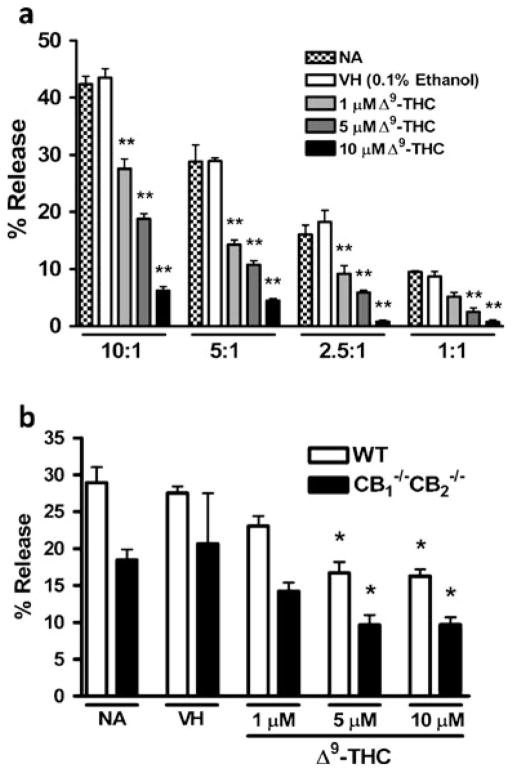
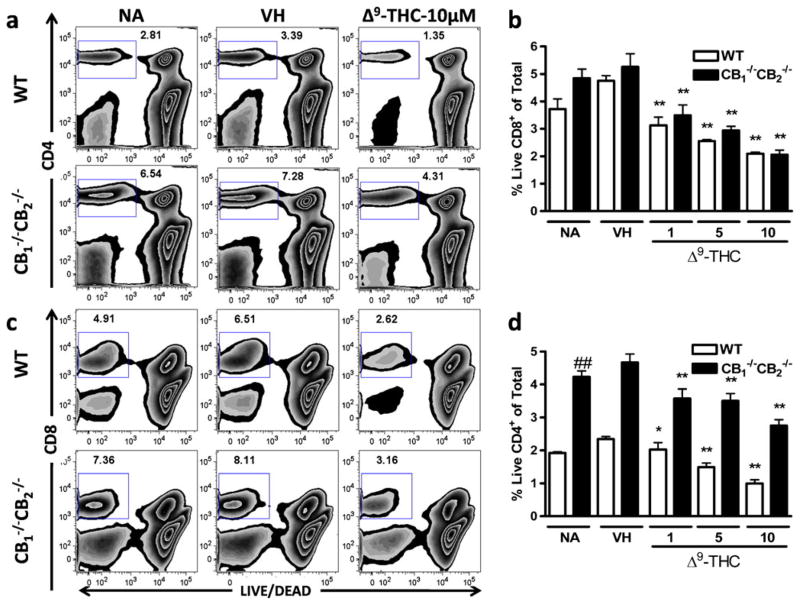
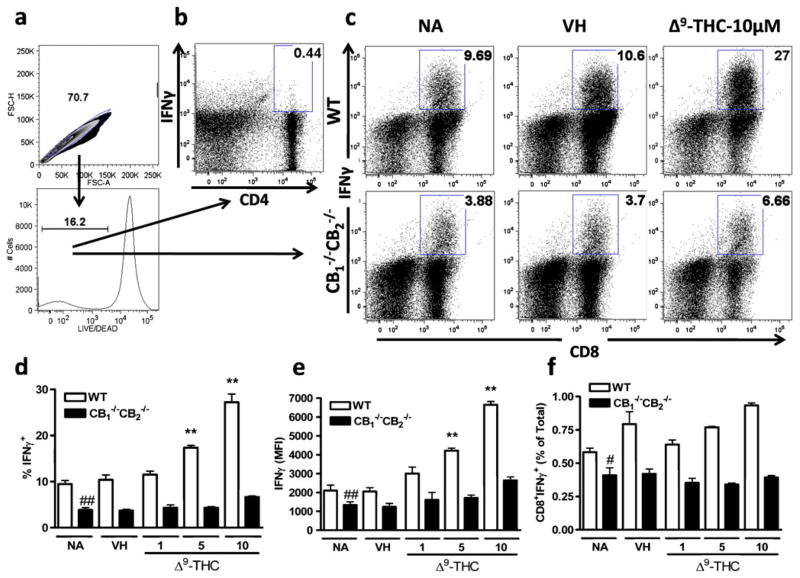
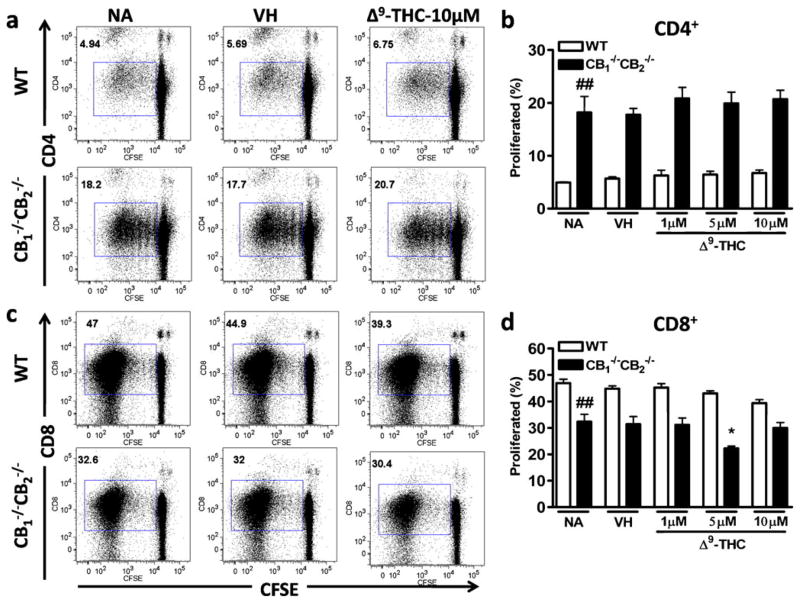
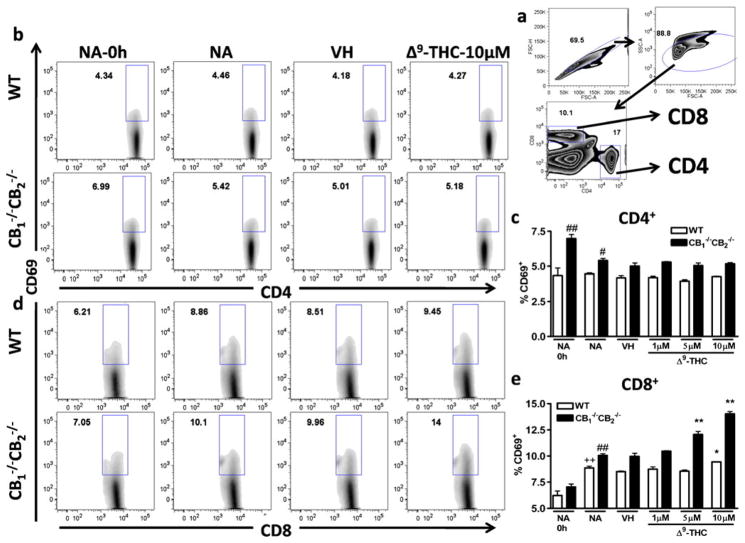
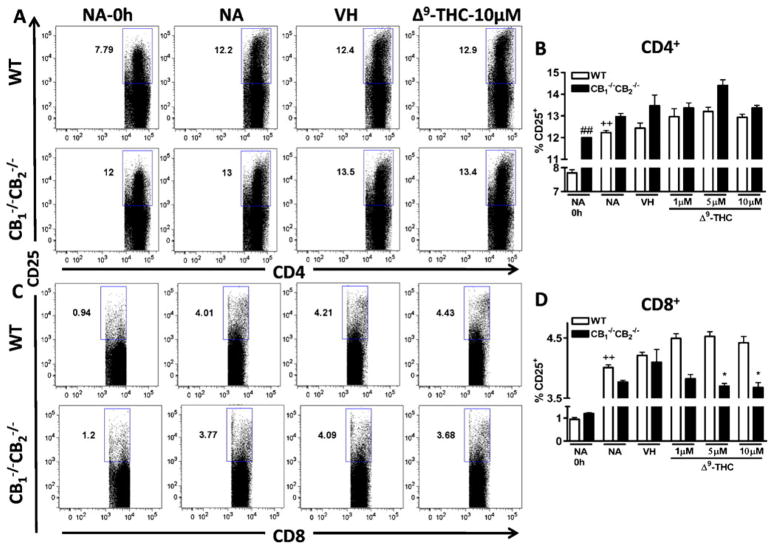
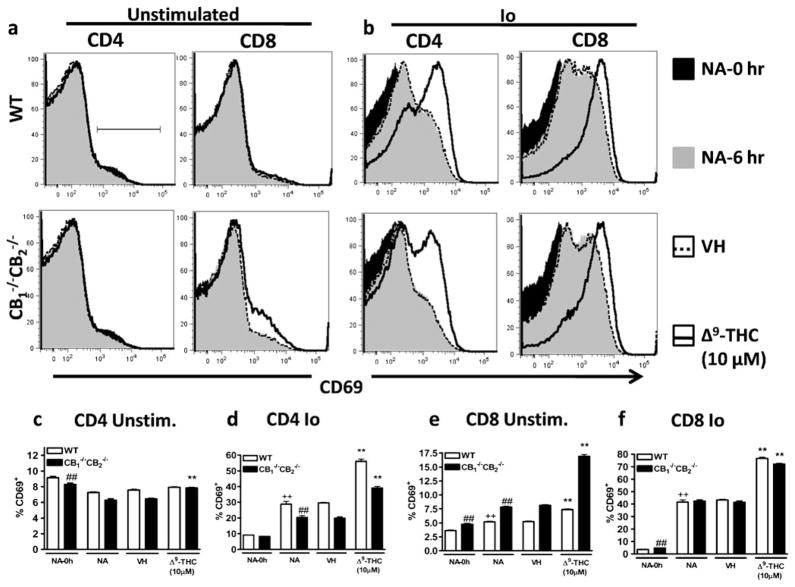
Previously, CD8(+) T cells were found to be a sensitive target for suppression by Δ(9)-tetrahydrocannabinol (Δ(9)-THC) in a murine model of influenza infection. To study the effect of Δ(9)-THC on CD8(+) cytotoxic T lymphocytes (CTL), an allogeneic model of MHC I mismatch was used to elicit CTL. In addition, to determine the requirement for the cannabinoid receptors 1 (CB(1)) and 2 (CB(2)) in Δ(9)-THC-mediated CTL response modulation, mice null for both receptors were used (CB(1) (-/-)CB(2) (-/-)). Δ(9)-THC suppressed CTL function independent of CB(1) and CB(2) as evidenced by reduction of (51)Cr release by CTL generated from CB(1) (-/-)CB(2) (-/-) mice. Furthermore, viability in CD4(+) and CD8(+) cells was reduced in a concentration-dependent manner with Δ(9)-THC, independent of CB(1) and CB(2), but no effect of Δ(9)-THC on proliferation was observed, suggesting that Δ(9)-THC decreases the number of T cells initially activated. Δ(9)-THC increased expression of the activation markers, CD69 in CD8(+) cells and CD25 in CD4(+) cells in a concentration-dependent manner in cells derived from WT and CB(1) (-/-)CB(2) (-/-) mice. Furthermore, Δ(9)-THC synergized with the calcium ionophore, ionomycin, to increase CD69 expression on both CD4(+) and CD8(+) cells. In addition, without stimulation, Δ(9)-THC increased CD69 expression in CD8(+) cells from CB(1) (-/-)CB(2) (-/-) and WT mice. Overall, these results suggest that CB(1) and CB(2) are dispensable for Δ(9)-THC-mediated suppression and that perturbation of Ca(2+) signals during T cell activation plays an important role in the mechanism by which Δ(9)-THC suppresses CTL function.


Figures

Fig. 1
Fig. 1
CTL activity peaks at day 5 after elicitation. To determine the peak day of CTL activity, splenocytes from WT and CB1 −/−CB2 −/− mice were co-cultured with irradiated P815 cells to elicit an allogeneic CTL response. On various days after elicitation, CTL were harvested and assayed for target (P815) lysing activity by reincubation at a ratio of 50:1 (Effector CTL : P815 Targets) with 51Cr labeled P815 cells. Percent release was calculated as described in Methods (n=4). The experiment was performed once, while more replicate experiments were performed for WTonly. ## p≤0.01 indicates difference between WT and CB1 −/−CB2 −/−
Fig. 2
Fig. 2
Δ9-THC suppresses CTL activity during elicitation but not effector phase. Splenocytes were treated with Δ9-THC and/or VH (0.1% ethanol) and stimulated with irradiated P815 cells for 5 days. After harvest, CTL were reincubated at a 10:1 ratio with 51Cr labeled P815 cells in the presence of Δ9-THC and appropriate controls (NA–naïve: no treatment; VH–0.1% ethanol) (n=4). Data shown are representative of two repeat experiments. * p≤0.05 indicates difference as compared to VH
Fig. 3
Fig. 3
Δ9-THC suppresses CTL activity in a concentration-dependent manner. Splenocytes from WT mice were treated with 1, 5 and 10 μM of Δ9-THC and/or VH (control) and co-cultured for 5 days with irradiated P815 cells. After harvest, CTL were reincubated with 51Cr labeled P815 cells at indicated ratios of 10:1 to 1:1 (a) (n=4). In a second experiment splenocytes from WTand CB1 −/−CB2 −/− mice were elicited and restimulated with 51Cr labeled P815 cells at a ratio of 10:1 (b) (n=4). Data shown are representative of two repeat experiments. * p≤0.05, ** p≤0.01 indicate differences as compared to VH
Fig. 4
Fig. 4
Lower viability of CD4+ and CD8+ cells following Δ9-THC treatment. CTL were elicited from splenocytes of WTand CB1 −/−CB2 −/− mice in the presence or absence of VH (0.1% ethanol) or Δ9-THC (1, 5, and 10 μM). After 5 days in culture, CD4 and CD8 surface staining was performed and viability was assessed using LIVE/DEAD staining. Viability was determined within CD4+ (a, b) and CD8+ (c, d) cells after singlet and lymphocyte size gating (n=4). Data shown are representative of four repeat experiments. * p≤0.05, ** p≤0.01 indicate differences as compared to VH, ## p≤0.01 as compared to WT
Fig. 5
Fig. 5
Increased IFNγ production in live but not total cells after Δ9-THC treatment. CTL of WTand CB1 −/−CB2 −/− were elicited as before with and without VH (0.1% ethanol) or Δ9-THC (1, 5, 10 μM) treatment for 5 days. Cells were restimulated for 12 h in the presence of Brefeldin A and stained for CD4+, CD8+, LIVE/DEAD and IFNγ. Gating scheme is shown (a) for populations of CD4+ (b) and CD8+ (c) cells and dot plots indicate concatenated samples (n=4). Bar graph for CD8+ cells are shown within live populations % (d), MFI (e), and in % of total populations (f) (n=4). Data shown are representative of three repeat experiments. ** p≤0.01 indicate differences as compared to VH, ## p≤0.01 as compared to WT
Fig. 6
Fig. 6
No effect of Δ9-THC on proliferation. Splenocytes were isolated from WT and CB1 −/−CB2 −/− mice and labeled with Cell Trace CFSE according to manufacturer’s instructions. Four days after co-culture with irradiated P815 in the presence or absence of VH (0.1% ethanol) and Δ9-THC (1, 5, 10 μM), surface staining with CD4 and CD8 were performed and CFSE fluorescence was assessed by FACS. Shown are concatenated samples (n=4) of CFSE staining as a result of proliferation in CD4+ (a, b) and CD8+ cells (c, d). Data shown are representative of two repeat experiments. * p≤0.05 indicate differences as compared to VH, ## p≤0.01 as compared to WT
Fig. 7
Fig. 7
Δ9-THC increases CD69 expression on CD8+ cells in a concentration-dependent manner. Splenocytes from of WT and CB1 −/− CB2−/− mice were incubated with irradiated P815 cells for 6 h to induce CD69 surface expression, in the presence or absence of VH (0.1% ethanol) or Δ9-THC (1, 5, and 10 μM). Cells were gated on singlets and lymphocyte populations by size and then on CD4 and CD8 (a). CD4+ (b, c) and CD8+ (d, e) cells positive as defined by the box gate for CD69 in % are shown (n=4). Data shown are representative of three repeat experiments. Difference due to stimulation by P815 is indicated by ++ p≤0.01, due to genotypes by ## p≤0.01, due to Δ9-THC by * p≤0.05,** p≤0.01
Fig. 8
Fig. 8
Δ9-THC decreases CD25 expression on CD8+ cells from CB1−/− CB2−/− mice in a concentration-dependent manner. Splenocytes from WT and CB1−/− CB2−/− mice were co-cultured with irradiated P815 cells for 12 h to induce CD25 levels, in the presence or absence of VH (0.1% ethanol) or Δ9-THC (1,5, and 10 μM). Cells were gated on singlets and lymphocyte populations by size and cells positive for CD25 in % are shown (n=4). Data shown are representative of two repeat experiments. Difference due to stimulation by P815 is indicated by ++ p≤0.01, due to genotypes by ## p≤0.01, due to Δ9-THC by * p≤0.05
Fig. 9
Fig. 9
Δ9-THC synergizes with Io to upregulate CD69 expression. Splenocytes were incubated in the presence of Io (0.5 μM) or VH (0.01% DMSO) in the presence or absence of VH (0.1% ethanol) or Δ9-THC (1, 5, and 10 μM). For NA-0 h, CD69 staining was performed after isolation of a single cell suspension from the spleen otherwise 6 h after co-culture. Cells were gated on singlet, lymphocytes and within CD4 (ad) or CD8 (a, b, e, f) positive populations. Data shown in histograms are concatenated (n=4) and are representative of two repeat experiments. Difference due to stimulation by Io is indicated by ++ p≤0.01, due to genotypes by ## p≤0.01, due to Δ9-THC by ** p≤0.01

Comment in

References

    1. Ashton CH. Pharmacology and effects of cannabis: a brief review. Br J Psychiatry. 2001;178:101–106. - PubMed
    1. Azorlosa JL, Heishman SJ, Stitzer ML, Mahaffey JM. Marijuana smoking: effect of varying delta 9-tetrahydrocannabinol content and number of puffs. J Pharmacol Exp Ther. 1992;261:114–122. - PubMed
    1. Bettelli E, Carrier Y, Gao W, Korn T, Strom TB, Oukka M, Weiner HL, Kuchroo VK. Reciprocal developmental pathways for the generation of pathogenic effector TH17 and regulatory T cells. Nature. 2006;441:235–238. - PubMed
    1. Boissonnas A, Fetler L, Zeelenberg IS, Hugues S, Amigorena S. In vivo imaging of cytotoxic T cell infiltration and elimination of a solid tumor. J Exp Med. 2007;204:345–356. - PMC - PubMed
    1. Brenchley JM, Douek DC, Ambrozak DR, Chatterji M, Betts MR, Davis LS, Koup RA. Expansion of activated human naive T-cells precedes effector function. Clin Exp Immunol. 2002;130:432–440. - PMC - PubMed

Publication types

MeSH terms