

Review
doi: 10.3928/15428877-20110627-01.
Clinical use of OCT in assessing glaucoma progression
Affiliations
- PMID: 21790113
- PMCID: PMC3407561
- DOI: 10.3928/15428877-20110627-01
Item in Clipboard
Review
Clinical use of OCT in assessing glaucoma progression
Ophthalmic Surg Lasers Imaging.
2011 Jul.
Abstract
Detection of disease progression is an important and challenging component of glaucoma management. Optical coherence tomography (OCT) has proved to be valuable in the detection of glaucomatous damage. With its high resolution and proven measurement reproducibility, OCT has the potential to become an important tool for glaucoma progression detection. This manuscript presents the capabilities of the OCT technology pertinent for detection of progressive glaucomatous damage and provides a review of the current knowledge on the device's clinical performance.
Copyright 2011, SLACK Incorporated.
Figures
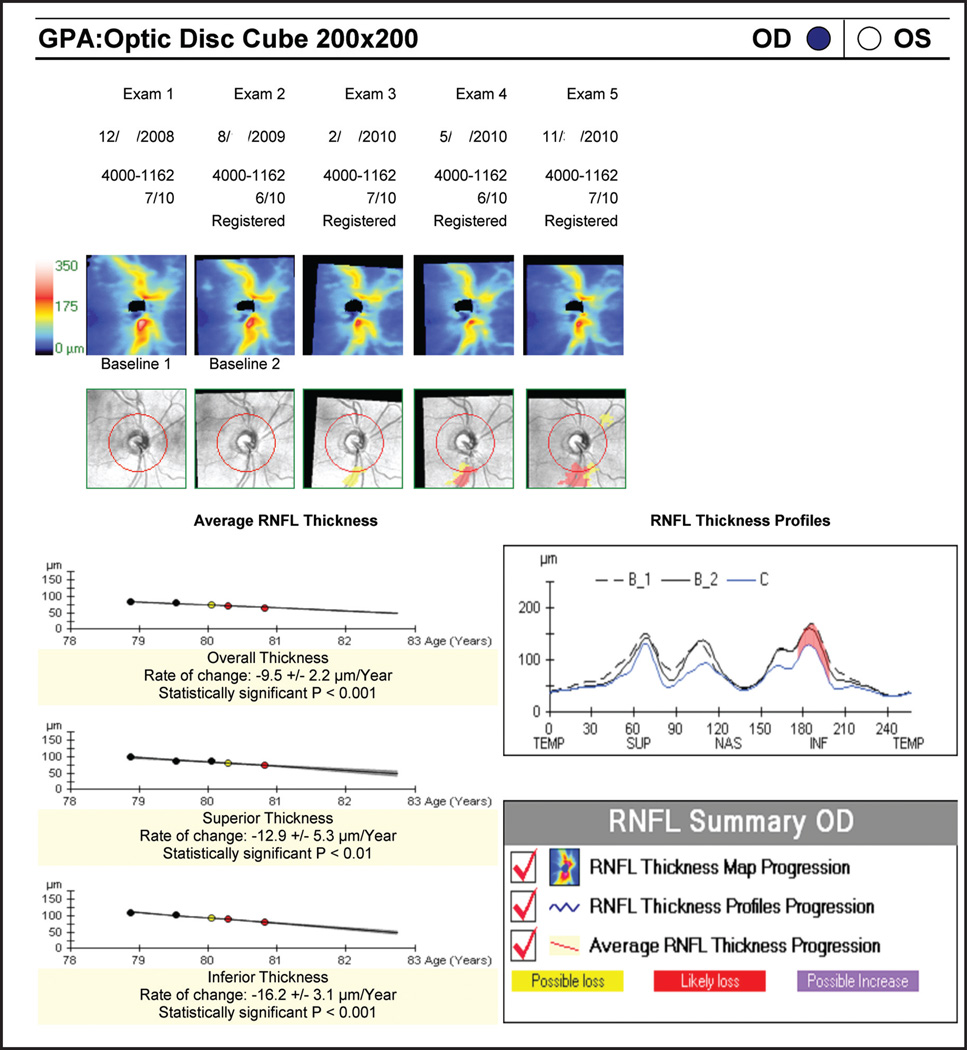
Cirrus Spectral-Domain Optical Coherence Tomography Retinal Nerve Fiber Layer (RNFL) Guided Progression Analysis (GPA) (Carl Zeiss Meditec, Dublin, CA). RNFL Thickness Maps (top panel) show graduate progression in the inferotemporal region (yellow and red sectors). The inferotemporal progression is also notable in the RNFL Thickness Profiles (red; right panel). Average RNFL Thickness plots (left panel) show statistically significant thinning in the overall, superior and inferior RNFL thickness. OD = right eye; OS = left eye.
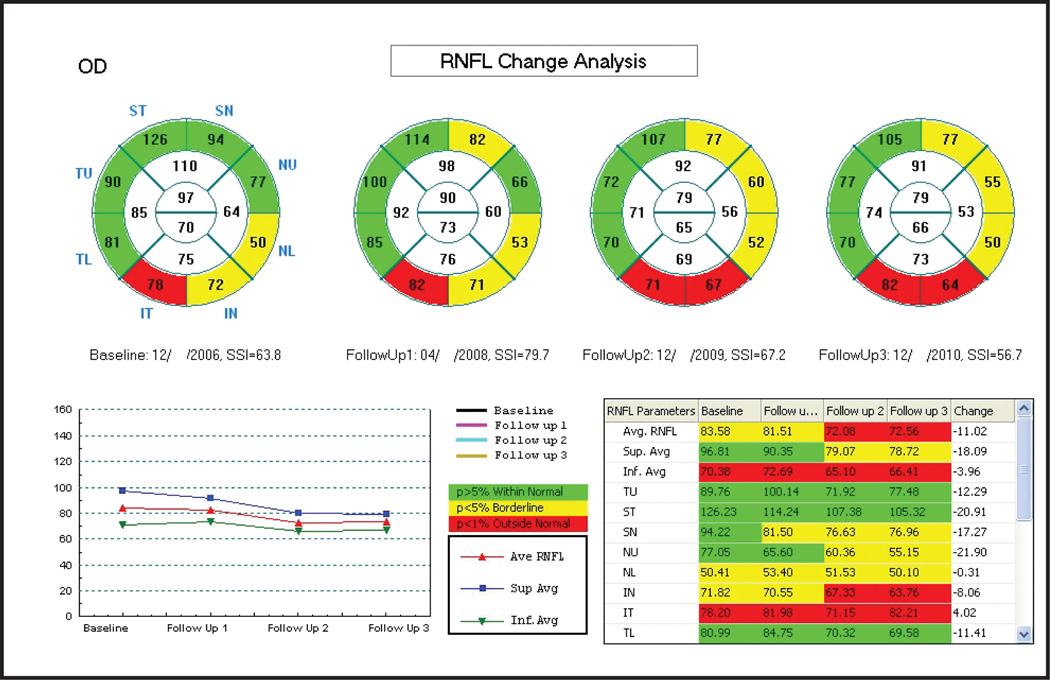
RTVue Spectral-Domain Optical Coherence Tomography Retinal Nerve Fiber Layer (RNFL) Change Analysis (Optovue, Fremont, CA). RNFL sectoral thickness measurements in comparison with normative data indicate nasal expansion of an inferior RNFL defect. Thickness plot (bottom left) shows progressive decreases in average (red), superior (blue) and inferior (green) RNFL thicknesses over time.
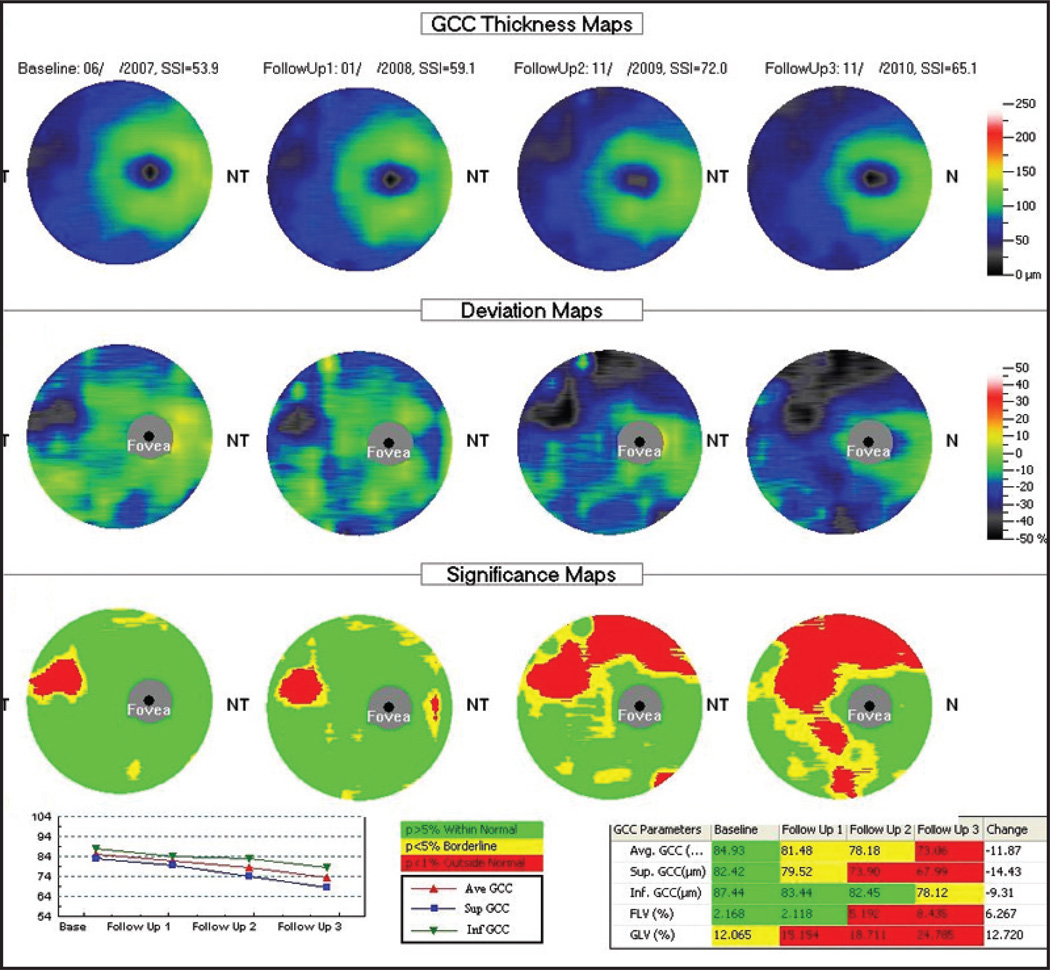
RTVue Spectral-Domain Optical Coherence Tomography Ganglion Cell Complex (GCC) Progression Analysis (Optovue, Fremont, CA). Deviation maps show a focal damage to the GCC in the temporal region progressively expanding superiorly along with a new localized damage in the inferior region of the macula. Significance maps in comparison with a normative database reveal a gradually increasing area of damaged GCC. Thickness plot (bottom left) shows progressive decreases in average (red), inferior (green), and superior (blue) GCC thicknesses over time.
References
-
- American Academy of Ophthalmology. Preferred Practice Pattern: Primary Open-Angle Glaucoma. San Francisco: Author; 2003. pp. 1–40.
-
- Johnson CA, Samuels SJ. Screening for glaucomatous visual field loss with frequency-doubling perimetry. Invest Ophthalmol Vis Sci. 1997;38:413–425. - PubMed
-
- Sommer A, Katz J, Quigley HA, et al. Clinically detectable nerve fiber atrophy precedes the onset of glaucomatous field loss. Arch Ophthalmol. 1991;109:77–83. - PubMed
-
- Quigley HA, Katz J, Derick RJ, Gilbert D, Sommer A. An evaluation of optic disc and nerve fiber layer examinations in monitoring progression of early glaucoma damage. Ophthalmology. 1992;99:19–28. - PubMed
Publication types
MeSH terms
Grants and funding
LinkOut - more resources
Full Text Sources
Other Literature Sources
Medical