. 2012 Jan;36(1):61-71.
doi: 10.1111/j.1530-0277.2011.01581.x. Epub 2011 Jul 25.

Histone deacetylases (HDAC)-induced histone modifications in the amygdala: a role in rapid tolerance to the anxiolytic effects of ethanol

Affiliations

Histone deacetylases (HDAC)-induced histone modifications in the amygdala: a role in rapid tolerance to the anxiolytic effects of ethanol

Amul J Sakharkar et al. Alcohol Clin Exp Res. 2012 Jan.

Abstract

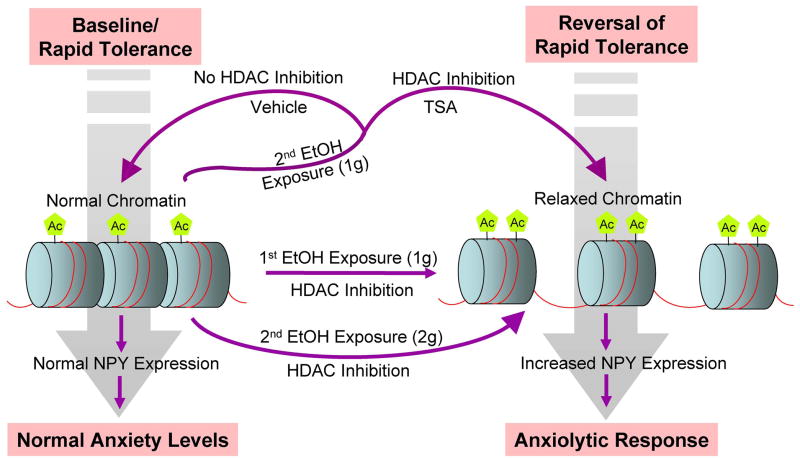
Background: Rapid tolerance to the anxiolytic effects of ethanol appears to be an important factor in the development of alcoholism. Here, we investigated the involvement of amygdaloid histone deacetylases (HDAC)-induced epigenetic changes in rapid ethanol tolerance (RET).

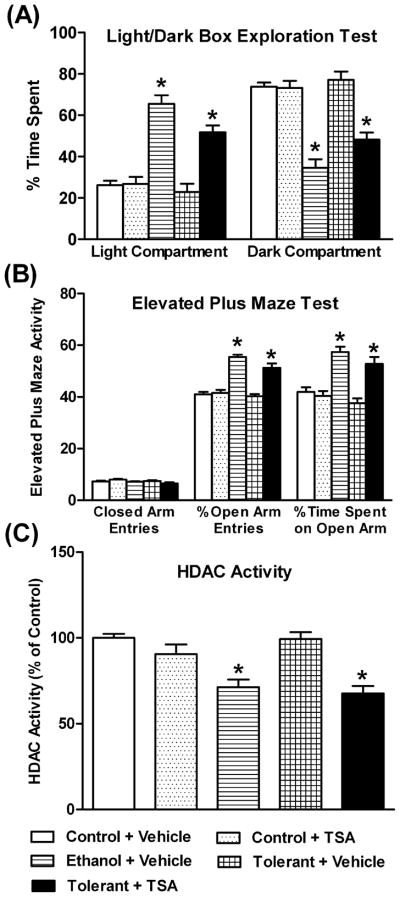
Methods: RET in rats was induced by 2 ethanol injections administered 24 hours apart. Both ethanol-tolerant and control rats were treated with the HDAC inhibitor, trichostatin A (TSA), and anxiety-like behaviors were measured. HDAC activity, histone (H3 and H4) acetylation, and neuropeptide Y (NPY) expression in the amygdala of these rats were also measured.

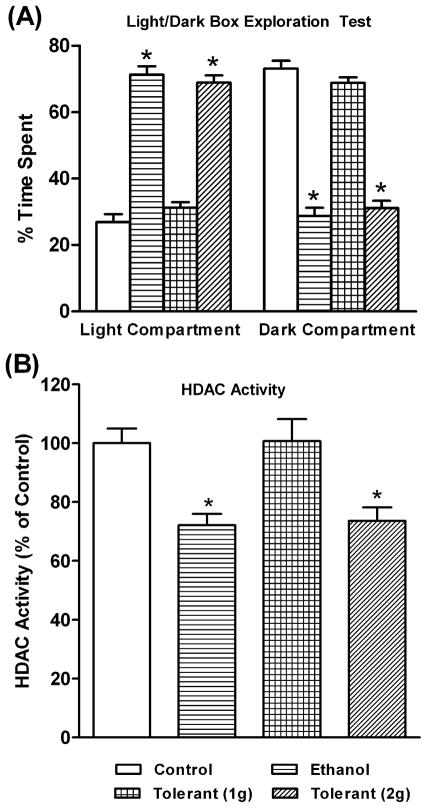
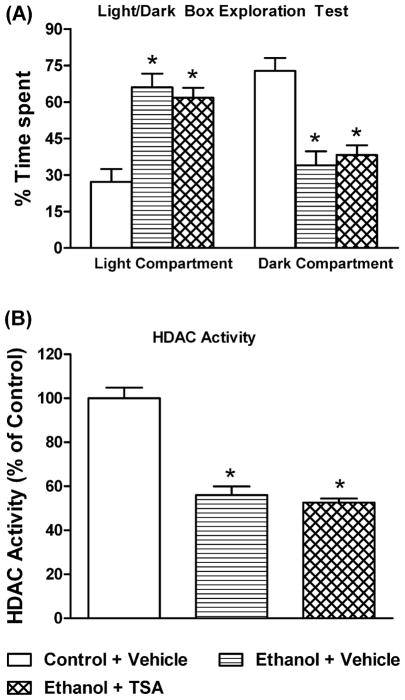
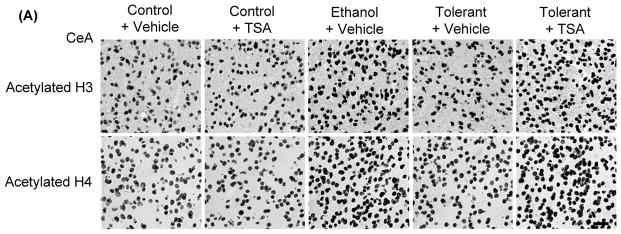
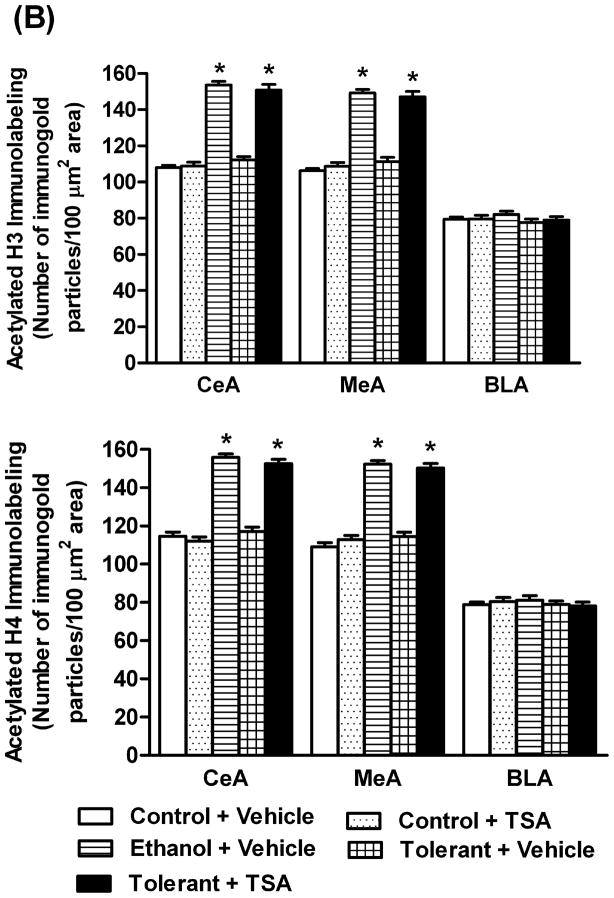
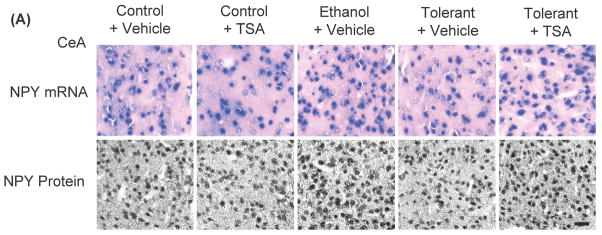
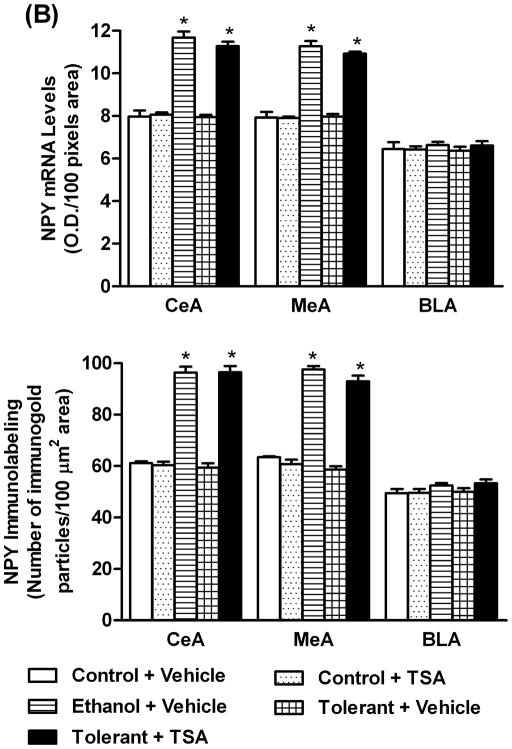
Results: A single ethanol exposure was able to produce an anxiolytic response, inhibit amygdaloid HDAC activity, and increase both histone acetylation and NPY expression (mRNA and protein levels) in the central nucleus of amygdala (CeA) and medial nucleus of amygdala (MeA) of rats. In contrast, 2 exposures of the same dose of ethanol (24 hours apart) neither elicited a similar anxiolytic response nor modulated HDAC activity, histone acetylation, or NPY expression in the amygdala. However, exposure to a higher dose of ethanol on the second day was able to produce an anxiolytic response and also inhibit amygdaloid HDAC activity. TSA treatment caused the reversal of RET by inhibiting HDAC activity, thereby increasing histone acetylation and NPY expression in the CeA and MeA.

Conclusions: Cellular tolerance to the initial acute ethanol-induced inhibition of HDAC activity and the subsequent upregulation of histone acetylation and NPY expression in the amygdala may be involved in the mechanisms underlying rapid tolerance to the anxiolytic effects of ethanol.


Figures

Figure 1
Figure 1
The effects of acute ethanol exposure [Ethanol group (1 g/kg; I.P.)] and tolerance (1 g/kg or 2 g/kg) [Tolerant (1g) group or Tolerant (2g) group], on the light/dark box (LDB) exploration test of anxiety-like behavior (A) and HDAC activity in the amygdala of rats (B). Values are the mean ± SEM of 7 rats in each group. *Significantly different from their respective control groups [p<0.05-0.001; ANOVA (F 3, 24 =112, p<0.001 for LDB; F3, 24=8.6, p<0.001 for HDAC activity) followed by Tukey’s test].
Figure 2
Figure 2
The effects of acute ethanol exposure [Ethanol group (1 g/kg; I.P.)] and tolerance (1 g/kg) with (Tolerant+ TSA) or without TSA (Tolerant+ Vehicle) treatment on anxiety-like behavior in rats using the light/dark box exploration (LDB) test (A) and elevated plus maze (EPM) test (B), and HDAC activity in the amygdala (C). Values are the mean ± SEM of 6–9 rats for the LDB exploration test and HDAC activity measurement, whereas 10 rats per group for the EPM test. *Significantly different from their respective control groups [p<0.01-0.001; ANOVA (F4, 34=29.9, p<0.001 for LDB; F4, 45=16.8, p<0.001 for EPM % open arm time spent; F4, 45=36.5, p<0.001 for EPM % open arm entries; F4, 34=13.9, p<0.001 for HDAC activity) followed by Tukey’s test].
Figure 3
Figure 3
The effects of TSA pretreatment on acute ethanol exposure (1g/kg; I.P.)-mediated anxiolytic effects in rats using the light/dark box exploration (LDB) test (A) and inhibition of HDAC activity in the amygdala (B). Values are the mean ± SEM of 6 rats. *Significantly different from control group [p<0.001; ANOVA (F 2, 15 =18.0, p<0.001 for LDB; F2, 15=49.9, p<0.001 for HDAC activity) followed by Tukey’s test].
Figure 4
Figure 4
A) Representative low-magnification photomicrographs of acetylated histones H3 (Lys 9) and H4 (Lys 8) gold-immunolabeling in central amygdaloid (CeA) structures of control rats with (Control+ TSA) or without TSA (Control+ Vehicle) treatments, ethanol-treated rats (Ethanol+ Vehicle) or ethanol-tolerant rats with (Tolerant+ TSA) or without TSA (Tolerant+ Vehicle) treatments (Scale bar = 40 μm). B) Changes in the acetylation of histones H3 and H4 in various amygdaloid (CeA, MeA, and BLA) structures of control rats with (Control+ TSA) or without (Control+ Vehicle) TSA treatments, ethanol-treated rats (Ethanol+ Vehicle) and ethanol-tolerant rats with (Tolerant+ TSA) or without (Tolerant+ Vehicle) TSA treatments. Values are the mean ± SEM of 5–6 rats per group. *Significantly different from their respective control groups [p<0.001; ANOVA (acetylated histone H3: CeA, F4, 25=117.7, p<0.001; MeA, F4, 25=95, p<0.001; Acetylated histone H4: CeA, F4, 20=104.8, p<0.001; MeA, F4, 20=98.8, p<0.001) followed by Tukey’s test)].
Figure 4
Figure 4
A) Representative low-magnification photomicrographs of acetylated histones H3 (Lys 9) and H4 (Lys 8) gold-immunolabeling in central amygdaloid (CeA) structures of control rats with (Control+ TSA) or without TSA (Control+ Vehicle) treatments, ethanol-treated rats (Ethanol+ Vehicle) or ethanol-tolerant rats with (Tolerant+ TSA) or without TSA (Tolerant+ Vehicle) treatments (Scale bar = 40 μm). B) Changes in the acetylation of histones H3 and H4 in various amygdaloid (CeA, MeA, and BLA) structures of control rats with (Control+ TSA) or without (Control+ Vehicle) TSA treatments, ethanol-treated rats (Ethanol+ Vehicle) and ethanol-tolerant rats with (Tolerant+ TSA) or without (Tolerant+ Vehicle) TSA treatments. Values are the mean ± SEM of 5–6 rats per group. *Significantly different from their respective control groups [p<0.001; ANOVA (acetylated histone H3: CeA, F4, 25=117.7, p<0.001; MeA, F4, 25=95, p<0.001; Acetylated histone H4: CeA, F4, 20=104.8, p<0.001; MeA, F4, 20=98.8, p<0.001) followed by Tukey’s test)].
Figure 5
Figure 5
A) Representative low-magnification photomicrographs of NPY in situ RT-PCR (mRNA levels) and NPY gold-immunolabeling (protein levels) in central amygdaloid (CeA) structures of control rats with (Control+ TSA) or without TSA (Control+ Vehicle) treatments, ethanol-treated (Ethanol+ Vehicle) or ethanol-tolerant rats with (Tolerant+ TSA) or without TSA (Tolerant+ Vehicle) treatments (Scale bar= 40 μm). B) Changes in mRNA and protein levels of NPY in CeA, MeA, and BLA of control rats with (Control+ TSA) or without TSA (Control+ Vehicle) treatments, ethanol-treated (Ethanol+ Vehicle) or ethanol-tolerant rats with (Tolerant+ TSA) or without TSA (Tolerant+ Vehicle) treatments. Values are the mean ± SEM of 5 rats in each group. *Significantly different from their respective control groups (p<0.001; ANOVA (NPY protein: CeA, F4, 20=122.1, p<0.001; MeA, F4, 20=159.8, p<0.001; NPY mRNA: CeA, F 4, 20=83.1, p<0.001; MeA, F4, 20=89, p<0.001) followed by Tukey’s test)].
Figure 5
Figure 5
A) Representative low-magnification photomicrographs of NPY in situ RT-PCR (mRNA levels) and NPY gold-immunolabeling (protein levels) in central amygdaloid (CeA) structures of control rats with (Control+ TSA) or without TSA (Control+ Vehicle) treatments, ethanol-treated (Ethanol+ Vehicle) or ethanol-tolerant rats with (Tolerant+ TSA) or without TSA (Tolerant+ Vehicle) treatments (Scale bar= 40 μm). B) Changes in mRNA and protein levels of NPY in CeA, MeA, and BLA of control rats with (Control+ TSA) or without TSA (Control+ Vehicle) treatments, ethanol-treated (Ethanol+ Vehicle) or ethanol-tolerant rats with (Tolerant+ TSA) or without TSA (Tolerant+ Vehicle) treatments. Values are the mean ± SEM of 5 rats in each group. *Significantly different from their respective control groups (p<0.001; ANOVA (NPY protein: CeA, F4, 20=122.1, p<0.001; MeA, F4, 20=159.8, p<0.001; NPY mRNA: CeA, F 4, 20=83.1, p<0.001; MeA, F4, 20=89, p<0.001) followed by Tukey’s test)].
Figure 6
Figure 6
Representative photomicrographs showing immunofluorescence staining of acetylated histones H3 or H4, or NPY (green), and NeuN (red) in the cells of the central nucleus of amygdala (CeA). The yellow color represents localization of acetylated histones and NPY in NeuN-positive cells. Acetylated histones H3 and H4, and NPY are predominantly expressed in NeuN-positive cells. Scale bar = 50 μm.
Figure 7
Figure 7
A schematic model depicting the possible molecular mechanisms of rapid tolerance to the anxiolytic effects of ethanol, within the amygdaloid neurocircuitries (particularly central and medial amygdaloid structures). First acute ethanol exposure (1 g/kg) inhibits histone deacetylases (HDAC), thereby increasing histone acetylation (Ac). Increased histone acetylation opens the chromatin structure (relaxed chromatin), making it more accessible to transcriptional machinery, thereby increasing neuropeptide Y (NPY) gene expression, and ultimately eliciting an anxiolytic response. The second ethanol exposure using the same dose (1 g/kg) as the first ethanol exposure does not inhibit HDAC activity or increase histone acetylation, maintaining normal chromatin structure and no change in NPY expression or anxiety levels, i.e. development of rapid tolerance. However, treatment with the HDAC inhibitor, trichostatin A (TSA), prior to the second ethanol exposure (1 g/kg), prevents the expression of rapid ethanol tolerance by inhibiting HDAC and increasing both histone acetylation and NPY levels. On the other hand, a second ethanol exposure using a higher dose of ethanol (2 g/kg) elicited a similar response (inhibition of HDACs and anxiolytic effects) observed after the first ethanol exposure using a lower dose (1 g/kg), suggesting that higher concentrations of ethanol are needed during a second exposure to ethanol in order to overcome the onset of tolerance and experience the anxiolytic effects of ethanol. This may lead to development of alcohol addiction.

References

    1. Abel T, Zukin RS. Epigenetic targets of HDAC inhibition in neurodegenerative and psychiatric disorders. Curr Opin Pharmacol. 2008;8:57–64. - PMC - PubMed
    1. American Psychiatric Association. Diagnostic and Statistical Manual of Mental Disorders. 4. American Psychiatric Press; Washington DC, USA: 1994.
    1. Bolger TA, Yao TP. Intracellular trafficking of histone deacetylase 4 regulates neuronal cell death. J Neurosci. 2005;25:9544–9553. - PMC - PubMed
    1. Carrigan MH, Randall CL. Self-medication in social phobia: a review of alcohol literature. Addict Behav. 2003;28:269–284. - PubMed
    1. Chandler LJ, Harris RA, Crews FT. Ethanol tolerance and synaptic plasticity. Trends Pharmacol Sci. 1998;19:491–495. - PubMed

Publication types