

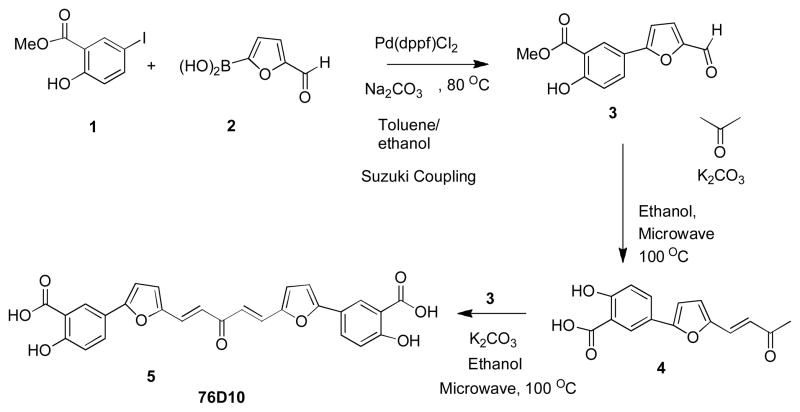
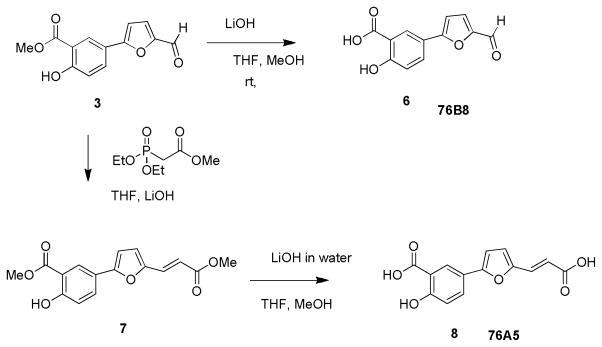
A disalicylic acid-furanyl derivative inhibits ephrin binding to a subset of Eph receptors
- PMID: 21791013
- PMCID: PMC3196665
- DOI: 10.1111/j.1747-0285.2011.01199.x
A disalicylic acid-furanyl derivative inhibits ephrin binding to a subset of Eph receptors
Abstract
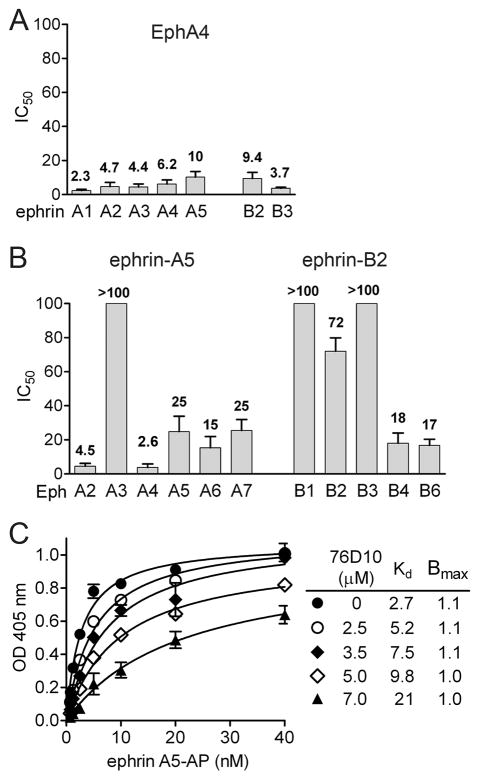
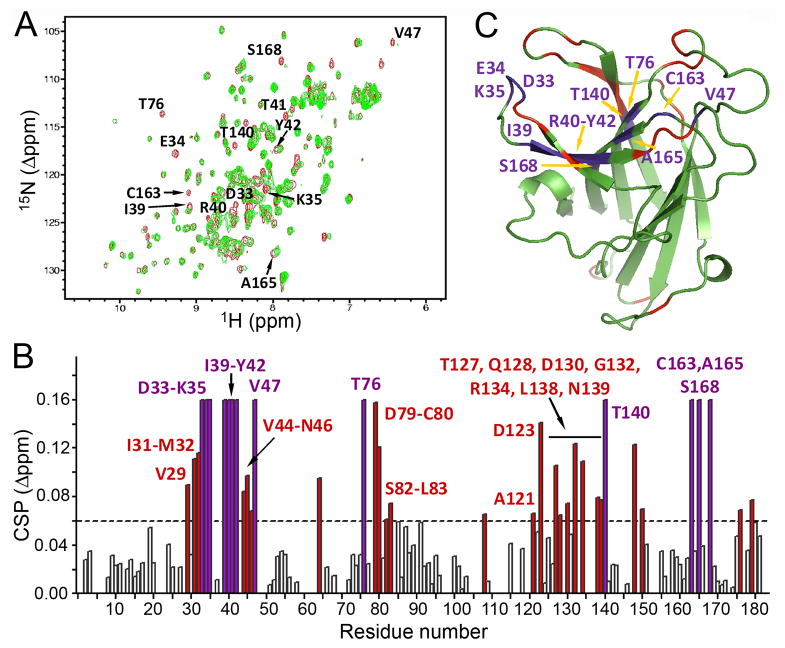
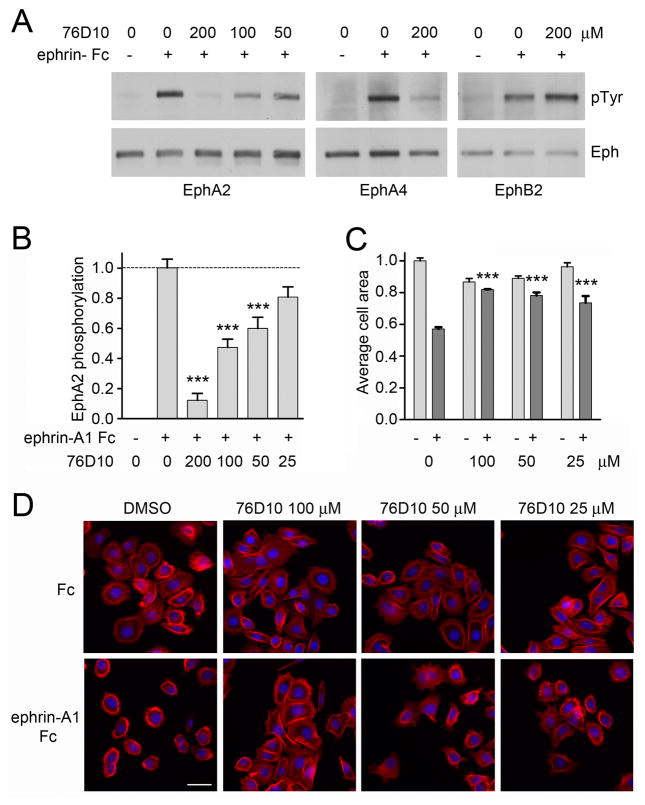
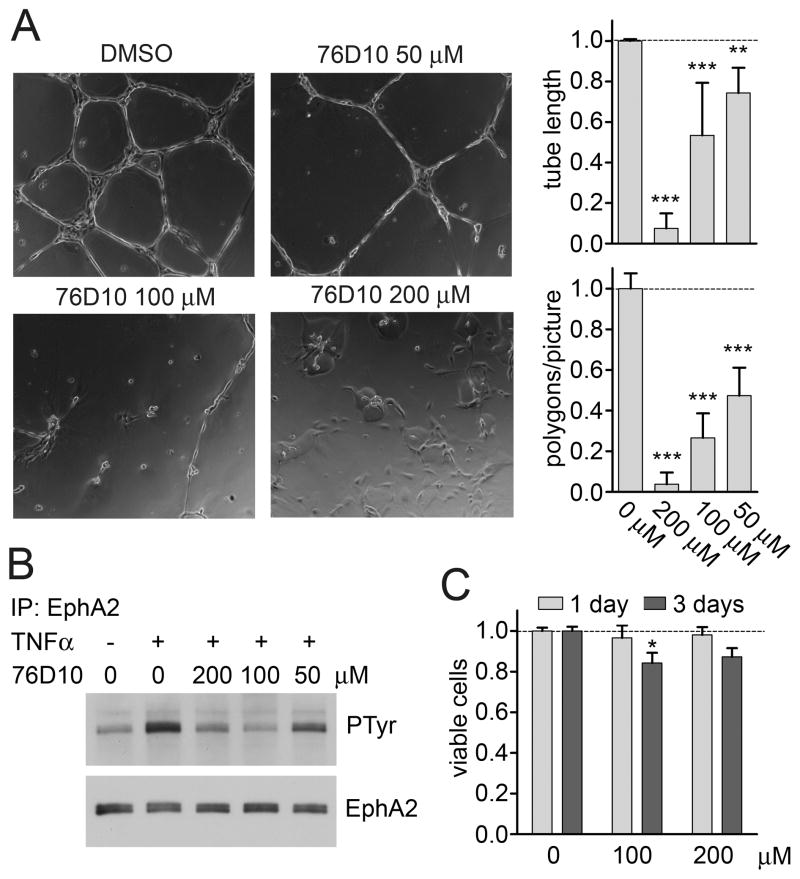
Eph receptor tyrosine kinases and ephrin ligands control many physiological and pathological processes, and molecules interfering with their interaction are useful probes to elucidate their complex biological functions. Moreover, targeting Eph receptors might enable new strategies to inhibit cancer progression and pathological angiogenesis as well as promote nerve regeneration. Because our previous work suggested the importance of the salicylic acid group in antagonistic small molecules targeting Eph receptors, we screened a series of salicylic acid derivatives to identify novel Eph receptor antagonists. This identified a disalicylic acid-furanyl derivative that inhibits ephrin-A5 binding to EphA4 with an IC(50) of 3 μm in ELISAs. This compound, which appears to bind to the ephrin-binding pocket of EphA4, also targets several other Eph receptors. Furthermore, it inhibits EphA2 and EphA4 tyrosine phosphorylation in cells stimulated with ephrin while not affecting phosphorylation of EphB2, which is not a target receptor. In endothelial cells, the disalicylic acid-furanyl derivative inhibits EphA2 phosphorylation in response to TNFα and capillary-like tube formation on Matrigel, two effects that depend on EphA2 interaction with endogenous ephrin-A1. These findings suggest that salicylic acid derivatives could be used as starting points to design new small molecule antagonists of Eph receptors.
© 2011 John Wiley & Sons A/S.
Figures
References
-
- Pasquale EB. Eph receptor signalling casts a wide net on cell behaviour. Nat Rev Mol Cell Biol. 2005;6:462–75. - PubMed
-
- Pasquale EB. Eph-ephrin promiscuity is now crystal clear. Nat Neurosci; 2004;7:417–8. - PubMed
-
- Jorgensen C, Sherman A, Chen GI, Pasculescu A, Poliakov A, Hsiung M, et al. Cell-specific information processing in segregating populations of Eph receptor ephrin-expressing cells. Science; 2009;326:1502–9. - PubMed
-
- Ireton RC, Chen J. EphA2 receptor tyrosine kinase as a promising target for cancer therapeutics. Curr Cancer Drug Targets; 2005;5:149–57. - PubMed
Publication types
MeSH terms
Substances
Grants and funding
LinkOut - more resources
Full Text Sources
Other Literature Sources
Chemical Information
Miscellaneous
