

PaCO2 and alveolar dead space are more relevant than PaO2/FiO2 ratio in monitoring the respiratory response to prone position in ARDS patients: a physiological study
- PMID: 21791044
- PMCID: PMC3387618
- DOI: 10.1186/cc10324
PaCO2 and alveolar dead space are more relevant than PaO2/FiO2 ratio in monitoring the respiratory response to prone position in ARDS patients: a physiological study
Abstract
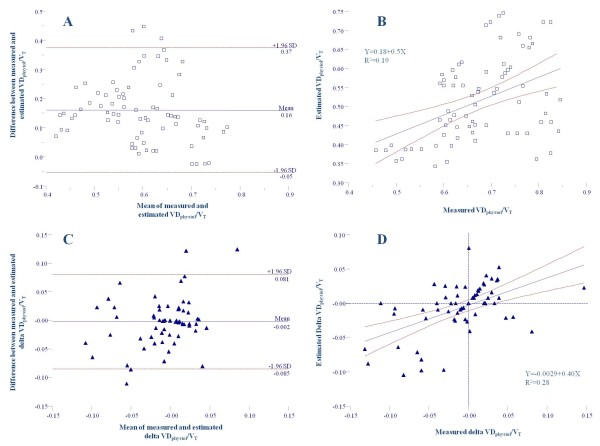
Introduction: Our aims in this study were to report changes in the ratio of alveolar dead space to tidal volume (VDalv/VT) in the prone position (PP) and to test whether changes in partial pressure of arterial CO2 (PaCO2) may be more relevant than changes in the ratio of partial pressure of arterial O2 to fraction of inspired O2 (PaO2/FiO2) in defining the respiratory response to PP. We also aimed to validate a recently proposed method of estimation of the physiological dead space (VDphysiol/VT) without measurement of expired CO2.
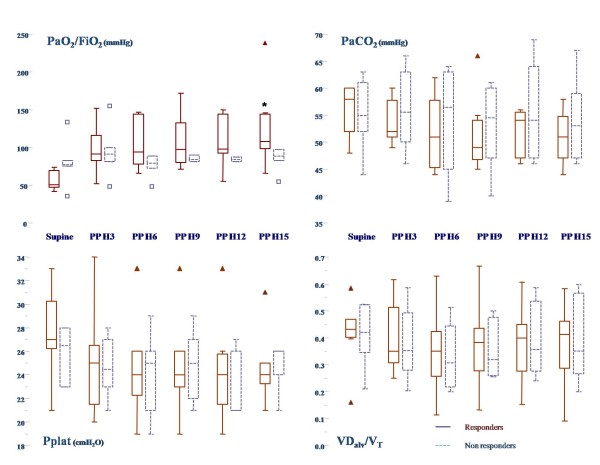
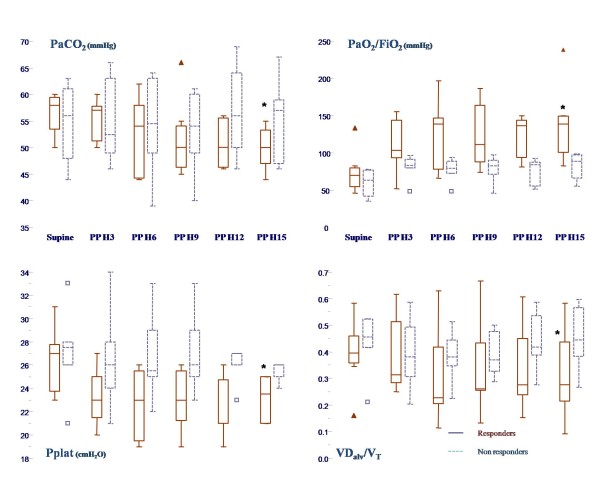
Methods: Thirteen patients with a PaO2/FiO2 ratio < 100 mmHg were included in the study. Plateau pressure (Pplat), positive end-expiratory pressure (PEEP), blood gas analysis and expiratory CO2 were recorded with patients in the supine position and after 3, 6, 9, 12 and 15 hours in the PP. Responders to PP were defined after 15 hours of PP either by an increase in PaO2/FiO2 ratio > 20 mmHg or by a decrease in PaCO2 > 2 mmHg. Estimated and measured VDphysiol/VT ratios were compared.
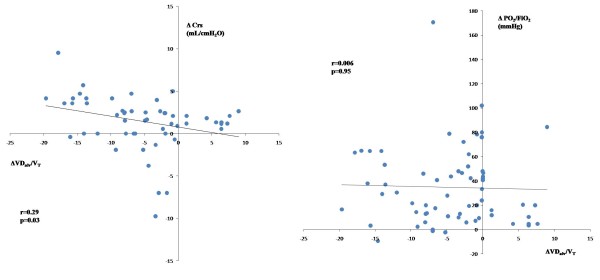
Results: PP induced a decrease in Pplat, PaCO2 and VDalv/VT ratio and increases in PaO2/FiO2 ratios and compliance of the respiratory system (Crs). Maximal changes were observed after six to nine hours. Changes in VDalv/VT were correlated with changes in Crs, but not with changes in PaO2/FiO2 ratios. When the response was defined by PaO2/FiO2 ratio, no significant differences in Pplat, PaCO2 or VDalv/VT alterations between responders (n = 7) and nonresponders (n = 6) were observed. When the response was defined by PaCO2, four patients were differently classified, and responders (n = 7) had a greater decrease in VDalv/VT ratio and in Pplat and a greater increase in PaO2/FiO2 ratio and in Crs than nonresponders (n = 6). Estimated VDphysiol/VT ratios significantly underestimated measured VDphysiol/VT ratios (concordance correlation coefficient 0.19 (interquartile ranges 0.091 to 0.28)), whereas changes during PP were more reliable (concordance correlation coefficient 0.51 (0.32 to 0.66)).
Conclusions: PP induced a decrease in VDalv/VT ratio and an improvement in respiratory mechanics. The respiratory response to PP appeared more relevant when PaCO2 rather than the PaO2/FiO2 ratio was used. Estimated VDphysiol/VT ratios systematically underestimated measured VDphysiol/VT ratios.
Figures
Comment in
-
Prognostic value of pulmonary dead space in patients with the acute respiratory distress syndrome.Crit Care. 2011;15(5):185. doi: 10.1186/cc10346. Epub 2011 Oct 25. Crit Care. 2011. PMID: 22067424 Free PMC article.
References
-
- Ashbaugh DG, Bigelow DB, Petty TL, Levine BE. Acute respiratory distress in adults. Lancet. 1967;2:319–323. - PubMed
-
- The Acute Respiratory Distress Syndrome Network. Ventilation with lower tidal volumes as compared with traditional tidal volumes for acute lung injury and the acute respiratory distress syndrome. N Engl J Med. 2000;342:1301–1308. - PubMed
-
- Puybasset L, Gusman P, Muller JC, Cluzel P, Coriat P, Rouby JJ. Regional distribution of gas and tissue in acute respiratory distress syndrome. III. Consequences for the effects of positive end-expiratory pressure. CT Scan ARDS Study Group. Adult Respiratory Distress Syndrome. Intensive Care Med. 2000;26:1215–1227. doi: 10.1007/s001340051340. - DOI - PubMed
-
- Rouby JJ, Brochard L. Tidal recruitment and overinflation in acute respiratory distress syndrome: yin and yang. Am J Respir Crit Care Med. 2007;175:104–106. - PubMed
Publication types
MeSH terms
Substances
LinkOut - more resources
Full Text Sources
Miscellaneous
